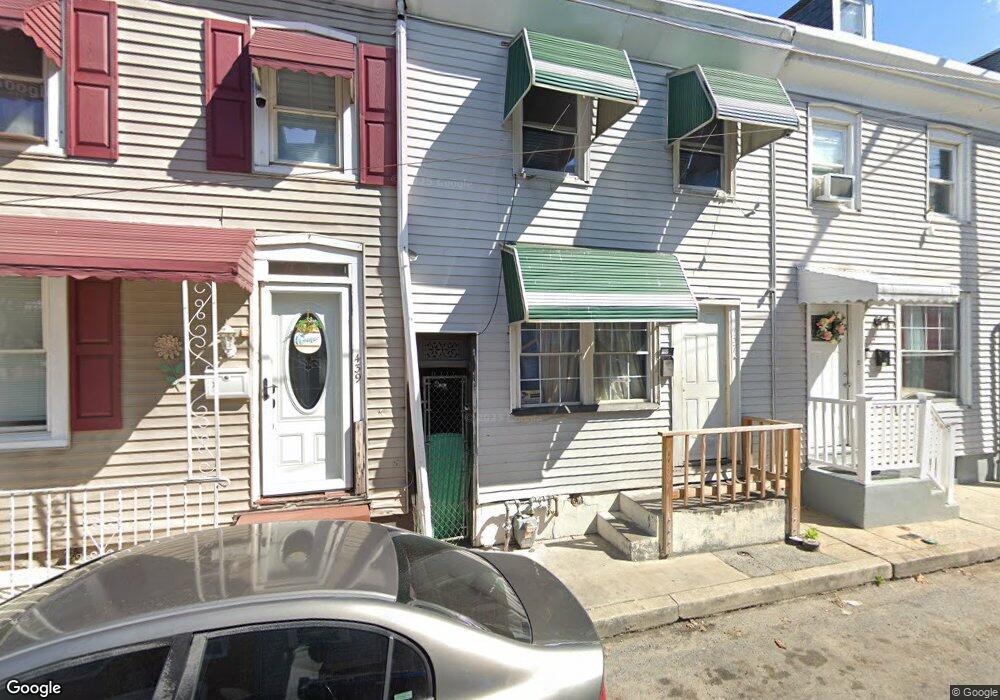
439 Locust St Reading, PA 19604
District 6 NeighborhoodEstimated Value: $79,000 - $162,000
3
Beds
1
Bath
1,278
Sq Ft
$104/Sq Ft
Est. Value
About This Home
This home is located at 439 Locust St, Reading, PA 19604 and is currently estimated at $133,028, approximately $104 per square foot. 439 Locust St is a home located in Berks County with nearby schools including 13th & Green Elementary School, Central Middle School, and Reading Senior High School.
Ownership History
Date
Name
Owned For
Owner Type
Purchase Details
Closed on
Jul 29, 2024
Sold by
Bermudez Rigoberto Cintron and Robles Heidy Torres
Bought by
Robles Heidy Torres
Current Estimated Value
Purchase Details
Closed on
Jul 31, 2015
Sold by
Chacon Sheronda
Bought by
Cintron Bermudez Rigoberto and Torres Robles Heidy
Home Financials for this Owner
Home Financials are based on the most recent Mortgage that was taken out on this home.
Original Mortgage
$23,000
Interest Rate
3.97%
Mortgage Type
New Conventional
Purchase Details
Closed on
Jul 27, 2001
Sold by
Almonte Yndira
Bought by
Chacon Emigidio H and Chacon Sheronda
Purchase Details
Closed on
Jun 20, 1997
Bought by
Chacon Sheronda
Create a Home Valuation Report for This Property
The Home Valuation Report is an in-depth analysis detailing your home's value as well as a comparison with similar homes in the area
Home Values in the Area
Average Home Value in this Area
Purchase History
| Date | Buyer | Sale Price | Title Company |
|---|---|---|---|
| Robles Heidy Torres | -- | None Listed On Document | |
| Cintron Bermudez Rigoberto | $31,000 | Conestoga Title Insurance | |
| Chacon Emigidio H | $2,500 | Conestoga Title | |
| Chacon Sheronda | $15,000 | -- |
Source: Public Records
Mortgage History
| Date | Status | Borrower | Loan Amount |
|---|---|---|---|
| Previous Owner | Cintron Bermudez Rigoberto | $23,000 |
Source: Public Records
Tax History Compared to Growth
Tax History
| Year | Tax Paid | Tax Assessment Tax Assessment Total Assessment is a certain percentage of the fair market value that is determined by local assessors to be the total taxable value of land and additions on the property. | Land | Improvement |
|---|---|---|---|---|
| 2025 | $882 | $32,500 | $14,000 | $18,500 |
| 2024 | $1,443 | $32,500 | $14,000 | $18,500 |
| 2023 | $1,421 | $32,500 | $14,000 | $18,500 |
| 2022 | $1,421 | $32,500 | $14,000 | $18,500 |
| 2021 | $1,421 | $32,500 | $14,000 | $18,500 |
| 2020 | $1,406 | $32,500 | $14,000 | $18,500 |
| 2019 | $1,406 | $32,500 | $14,000 | $18,500 |
| 2018 | $1,406 | $32,500 | $14,000 | $18,500 |
| 2017 | $1,397 | $32,500 | $14,000 | $18,500 |
| 2016 | $798 | $32,500 | $14,000 | $18,500 |
| 2015 | $798 | $32,500 | $14,000 | $18,500 |
| 2014 | $734 | $32,500 | $14,000 | $18,500 |
Source: Public Records
Map
Nearby Homes