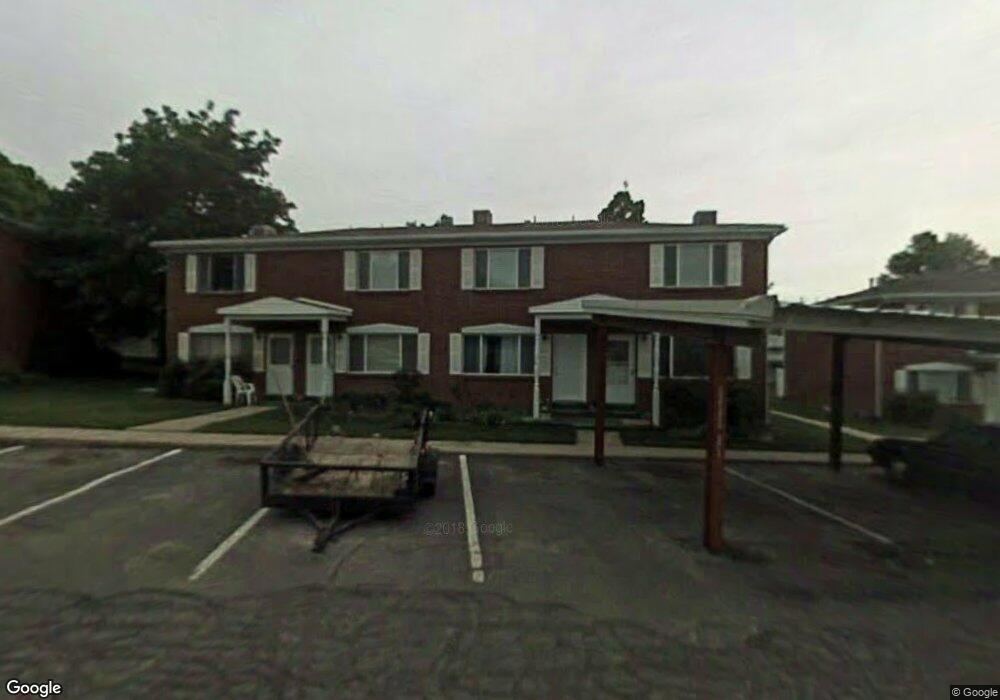
439 N 400 E Bountiful, UT 84010
Estimated Value: $301,000 - $329,000
2
Beds
1
Bath
914
Sq Ft
$345/Sq Ft
Est. Value
About This Home
This home is located at 439 N 400 E, Bountiful, UT 84010 and is currently estimated at $315,736, approximately $345 per square foot. 439 N 400 E is a home located in Davis County with nearby schools including Tolman School, Bountiful Junior High School, and Viewmont High School.
Ownership History
Date
Name
Owned For
Owner Type
Purchase Details
Closed on
Dec 21, 2020
Sold by
Esquire Management Llc
Bought by
Bytheway Karen A
Current Estimated Value
Home Financials for this Owner
Home Financials are based on the most recent Mortgage that was taken out on this home.
Original Mortgage
$219,450
Outstanding Balance
$195,376
Interest Rate
2.7%
Mortgage Type
New Conventional
Estimated Equity
$120,360
Purchase Details
Closed on
Oct 14, 2010
Sold by
Boswell David E
Bought by
Boswell David E and Boswell Tonya Howard
Purchase Details
Closed on
Aug 27, 2008
Sold by
Boswell David E
Bought by
Boswell David E and Boswell Michael J
Purchase Details
Closed on
May 1, 1996
Sold by
Jorgensen Tim S and Jorgensen Marie A
Bought by
Boswell Ronald E
Home Financials for this Owner
Home Financials are based on the most recent Mortgage that was taken out on this home.
Original Mortgage
$50,000
Interest Rate
7.82%
Mortgage Type
Purchase Money Mortgage
Create a Home Valuation Report for This Property
The Home Valuation Report is an in-depth analysis detailing your home's value as well as a comparison with similar homes in the area
Purchase History
| Date | Buyer | Sale Price | Title Company |
|---|---|---|---|
| Bytheway Karen A | -- | Us Title Company Of | |
| Boswell David E | -- | None Available | |
| Boswell David E | -- | None Available | |
| Boswell Ronald E | -- | -- |
Source: Public Records
Mortgage History
| Date | Status | Borrower | Loan Amount |
|---|---|---|---|
| Open | Bytheway Karen A | $219,450 | |
| Previous Owner | Boswell Ronald E | $50,000 |
Source: Public Records
Tax History
| Year | Tax Paid | Tax Assessment Tax Assessment Total Assessment is a certain percentage of the fair market value that is determined by local assessors to be the total taxable value of land and additions on the property. | Land | Improvement |
|---|---|---|---|---|
| 2025 | $1,711 | $160,050 | $63,250 | $96,800 |
| 2024 | $1,632 | $155,650 | $50,050 | $105,600 |
| 2023 | $1,638 | $284,000 | $90,000 | $194,000 |
| 2022 | $1,660 | $157,850 | $40,700 | $117,150 |
| 2021 | $1,574 | $229,000 | $63,000 | $166,000 |
| 2020 | $1,293 | $188,000 | $55,600 | $132,400 |
| 2019 | $1,275 | $181,000 | $52,000 | $129,000 |
| 2018 | $1,095 | $152,000 | $54,000 | $98,000 |
| 2016 | $873 | $65,230 | $13,475 | $51,755 |
| 2015 | $833 | $58,575 | $13,475 | $45,100 |
| 2014 | $873 | $63,517 | $18,333 | $45,184 |
| 2013 | -- | $70,059 | $14,575 | $55,484 |
Source: Public Records
Map
Nearby Homes
- 453 N 400 E Unit 7-D
- 513 N 400 E Unit 14B
- 17 E 400 N Unit 19B
- 49 E 200 N Unit 4
- 41 E 200 N Unit 6
- 55 E 200 N Unit 2
- 51 E 200 N Unit 3
- 256 N Main St
- 254 N Main St
- 252 N Main St
- 978 N 170 E
- 683 E 100 N
- 214 E 1250 N
- 129 N 800 E
- 106 W 700 N
- 320 N 200 W Unit 4
- 255 E 400 S
- 6 N 800 E
- 357 S 100 E
- 499 N 200 W Unit 30
- 439 N 400 E Unit 6A
- 441 N 400 E
- 443 N 400 E
- 443 N 400 E Unit 6C
- 437 N 400 E Unit 5
- 445 N 400 E
- 435 N 400 E
- 433 N 400 E
- 431 N 400 E
- 375 E 400 N
- 447 N 400 E
- 449 N 400 E Unit 7B
- 451 N 400 E
- 451 N 400 E Unit 7-C
- 299 E 400 N
- 383 E 400 N
- 429 N 400 E
- 429 N 400 E Unit 4A
- 453 N 400 E Unit 5A
- 453 N 400 E Unit 9D
Your Personal Tour Guide
Ask me questions while you tour the home.