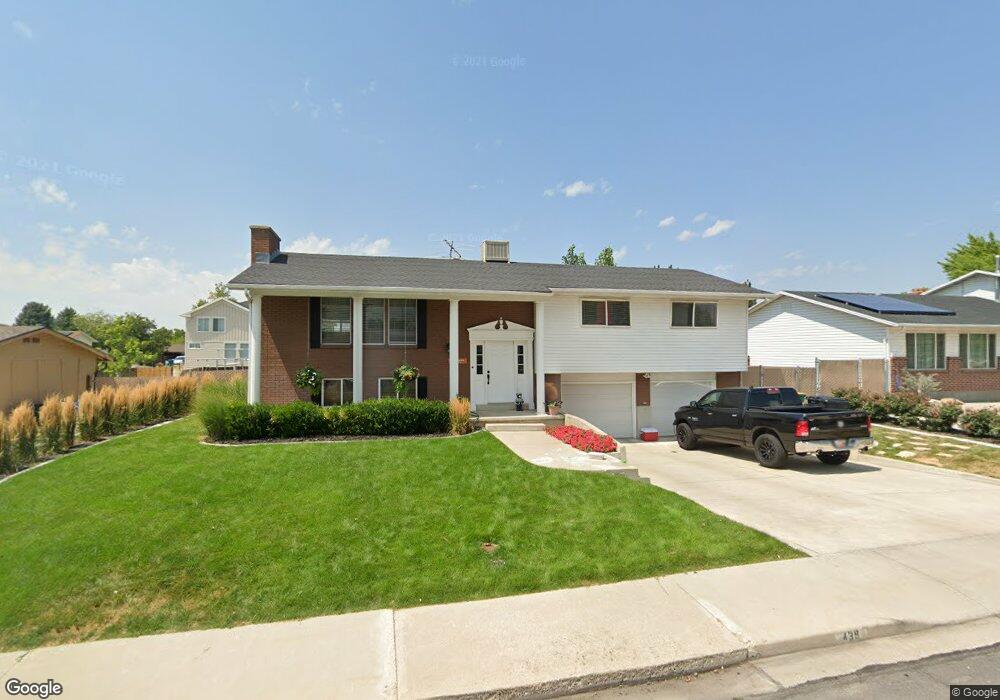
439 N 950 E Orem, UT 84097
Orchard South NeighborhoodEstimated Value: $524,000 - $708,000
4
Beds
3
Baths
1,377
Sq Ft
$433/Sq Ft
Est. Value
About This Home
This home is located at 439 N 950 E, Orem, UT 84097 and is currently estimated at $595,641, approximately $432 per square foot. 439 N 950 E is a home located in Utah County with nearby schools including Cascade Elementary School, Canyon View Junior High School, and Orem High School.
Ownership History
Date
Name
Owned For
Owner Type
Purchase Details
Closed on
Sep 11, 2015
Sold by
Mecham Casey W and Mecham Kimberley F
Bought by
Mecham Casey and Mecham Kimberley
Current Estimated Value
Home Financials for this Owner
Home Financials are based on the most recent Mortgage that was taken out on this home.
Original Mortgage
$165,500
Outstanding Balance
$129,767
Interest Rate
3.86%
Mortgage Type
New Conventional
Estimated Equity
$465,874
Purchase Details
Closed on
Jul 19, 2011
Sold by
Cookson Bennett Lee and Cookson Kathryn S
Bought by
Mecham Casey W and Mecham Kimberley F
Home Financials for this Owner
Home Financials are based on the most recent Mortgage that was taken out on this home.
Original Mortgage
$174,800
Interest Rate
4.45%
Mortgage Type
New Conventional
Create a Home Valuation Report for This Property
The Home Valuation Report is an in-depth analysis detailing your home's value as well as a comparison with similar homes in the area
Home Values in the Area
Average Home Value in this Area
Purchase History
| Date | Buyer | Sale Price | Title Company |
|---|---|---|---|
| Mecham Casey | -- | First American | |
| Mecham Casey W | -- | Utah First Title Insurance A |
Source: Public Records
Mortgage History
| Date | Status | Borrower | Loan Amount |
|---|---|---|---|
| Open | Mecham Casey | $165,500 | |
| Closed | Mecham Casey W | $174,800 |
Source: Public Records
Tax History
| Year | Tax Paid | Tax Assessment Tax Assessment Total Assessment is a certain percentage of the fair market value that is determined by local assessors to be the total taxable value of land and additions on the property. | Land | Improvement |
|---|---|---|---|---|
| 2025 | $2,195 | $280,170 | -- | -- |
| 2024 | $2,195 | $268,400 | $0 | $0 |
| 2023 | $2,001 | $262,955 | $0 | $0 |
| 2022 | $2,183 | $277,970 | $0 | $0 |
| 2021 | $1,834 | $353,700 | $158,000 | $195,700 |
| 2020 | $1,679 | $318,300 | $126,400 | $191,900 |
| 2019 | $1,511 | $297,800 | $115,200 | $182,600 |
| 2018 | $1,476 | $278,000 | $111,500 | $166,500 |
| 2017 | $1,379 | $139,150 | $0 | $0 |
| 2016 | $1,404 | $130,570 | $0 | $0 |
| 2015 | $1,327 | $116,765 | $0 | $0 |
| 2014 | $1,162 | $101,750 | $0 | $0 |
Source: Public Records
Map
Nearby Homes
Your Personal Tour Guide
Ask me questions while you tour the home.