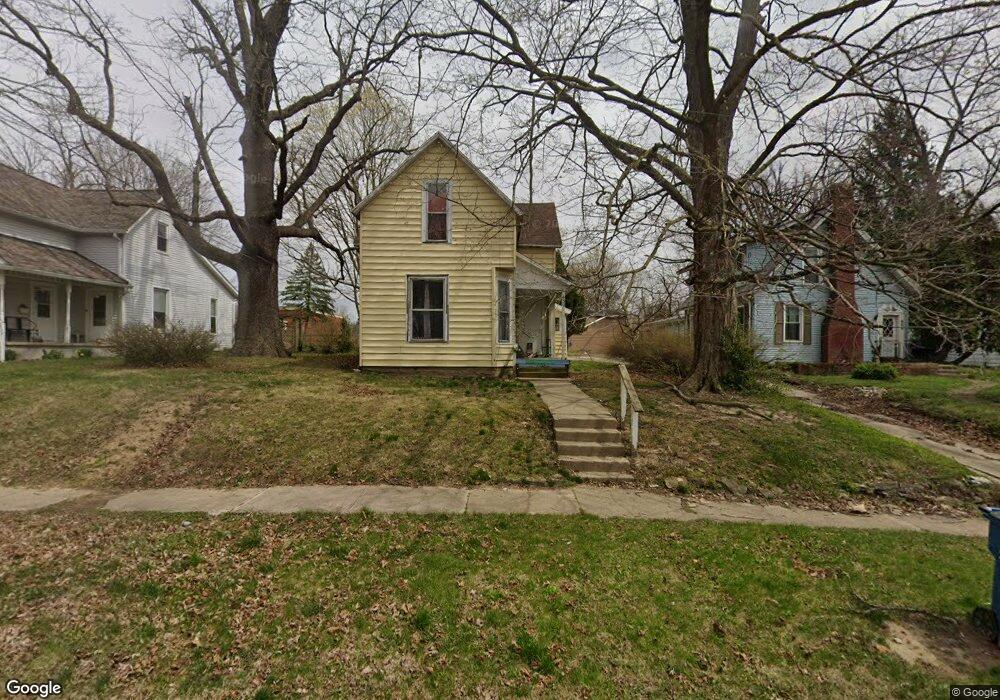
439 N Fisher St Wabash, IN 46992
Estimated Value: $104,000 - $169,000
3
Beds
2
Baths
1,536
Sq Ft
$81/Sq Ft
Est. Value
About This Home
This home is located at 439 N Fisher St, Wabash, IN 46992 and is currently estimated at $124,701, approximately $81 per square foot. 439 N Fisher St is a home located in Wabash County with nearby schools including O.J. Neighbours Elementary School, W C Mills Elementary School, and Wabash Middle School.
Ownership History
Date
Name
Owned For
Owner Type
Purchase Details
Closed on
Dec 31, 2019
Sold by
Mullett Kent A and Mullett Elizabeth T
Bought by
Collins Robert E and Collins Connie
Current Estimated Value
Home Financials for this Owner
Home Financials are based on the most recent Mortgage that was taken out on this home.
Original Mortgage
$14,400
Outstanding Balance
$11,308
Interest Rate
3.6%
Mortgage Type
Future Advance Clause Open End Mortgage
Estimated Equity
$113,393
Create a Home Valuation Report for This Property
The Home Valuation Report is an in-depth analysis detailing your home's value as well as a comparison with similar homes in the area
Home Values in the Area
Average Home Value in this Area
Purchase History
| Date | Buyer | Sale Price | Title Company |
|---|---|---|---|
| Collins Robert E | -- | None Available |
Source: Public Records
Mortgage History
| Date | Status | Borrower | Loan Amount |
|---|---|---|---|
| Open | Collins Robert E | $14,400 |
Source: Public Records
Tax History Compared to Growth
Tax History
| Year | Tax Paid | Tax Assessment Tax Assessment Total Assessment is a certain percentage of the fair market value that is determined by local assessors to be the total taxable value of land and additions on the property. | Land | Improvement |
|---|---|---|---|---|
| 2024 | $800 | $40,000 | $9,600 | $30,400 |
| 2023 | $788 | $39,400 | $9,600 | $29,800 |
| 2022 | $720 | $36,000 | $9,600 | $26,400 |
| 2021 | $658 | $32,900 | $9,600 | $23,300 |
| 2020 | $616 | $30,800 | $9,600 | $21,200 |
| 2019 | $594 | $29,700 | $9,600 | $20,100 |
| 2018 | $778 | $38,900 | $9,600 | $29,300 |
| 2017 | $766 | $37,100 | $9,600 | $27,500 |
| 2016 | $766 | $37,100 | $9,600 | $27,500 |
| 2014 | $702 | $36,800 | $9,600 | $27,200 |
| 2013 | $724 | $36,200 | $9,600 | $26,600 |
Source: Public Records
Map
Nearby Homes