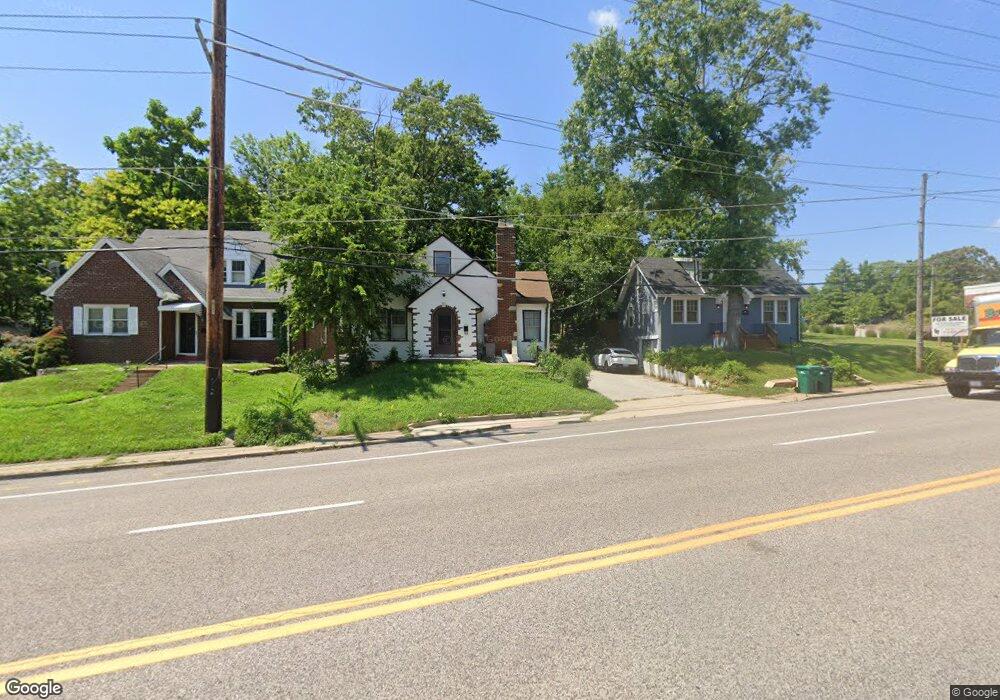
439 N Laclede Station Rd Saint Louis, MO 63119
Estimated Value: $270,000 - $298,000
2
Beds
1
Bath
1,285
Sq Ft
$222/Sq Ft
Est. Value
About This Home
This home is located at 439 N Laclede Station Rd, Saint Louis, MO 63119 and is currently estimated at $285,667, approximately $222 per square foot. 439 N Laclede Station Rd is a home located in St. Louis County with nearby schools including Avery Elementary School, Hixson Middle School, and Webster Groves High School.
Ownership History
Date
Name
Owned For
Owner Type
Purchase Details
Closed on
Feb 25, 2015
Sold by
Flanigan Michael S and Flanigan Emilie
Bought by
Flanigan Michael S and Flanigan Emilie
Current Estimated Value
Home Financials for this Owner
Home Financials are based on the most recent Mortgage that was taken out on this home.
Original Mortgage
$112,000
Outstanding Balance
$85,466
Interest Rate
3.66%
Mortgage Type
Credit Line Revolving
Estimated Equity
$200,201
Purchase Details
Closed on
Jun 8, 2009
Sold by
Graham Douglas
Bought by
Flanigan Michael S and Flanigan John P
Purchase Details
Closed on
Sep 16, 2008
Sold by
Haney Barbara D
Bought by
Henderson Arthur and Haney Amanda
Home Financials for this Owner
Home Financials are based on the most recent Mortgage that was taken out on this home.
Original Mortgage
$57,997
Interest Rate
6.46%
Mortgage Type
FHA
Purchase Details
Closed on
Feb 5, 1997
Sold by
Haney Joe T and Haney Barbara D
Bought by
Haney Nancy K
Create a Home Valuation Report for This Property
The Home Valuation Report is an in-depth analysis detailing your home's value as well as a comparison with similar homes in the area
Home Values in the Area
Average Home Value in this Area
Purchase History
| Date | Buyer | Sale Price | Title Company |
|---|---|---|---|
| Flanigan Michael S | -- | None Available | |
| Flanigan Michael S | $96,900 | Integrity Land Title Co Inc | |
| Graham Douglas | -- | Integrity Land Title Co Inc | |
| Henderson Arthur | $60,000 | Freedom Title Llc | |
| Haney Nancy K | -- | -- |
Source: Public Records
Mortgage History
| Date | Status | Borrower | Loan Amount |
|---|---|---|---|
| Open | Flanigan Michael S | $112,000 | |
| Previous Owner | Henderson Arthur | $57,997 |
Source: Public Records
Tax History Compared to Growth
Tax History
| Year | Tax Paid | Tax Assessment Tax Assessment Total Assessment is a certain percentage of the fair market value that is determined by local assessors to be the total taxable value of land and additions on the property. | Land | Improvement |
|---|---|---|---|---|
| 2025 | $2,995 | $53,790 | $18,160 | $35,630 |
| 2024 | $2,995 | $42,730 | $12,960 | $29,770 |
| 2023 | $2,981 | $42,730 | $12,960 | $29,770 |
| 2022 | $2,923 | $38,900 | $12,960 | $25,940 |
| 2021 | $2,913 | $38,900 | $12,960 | $25,940 |
| 2020 | $3,015 | $37,530 | $12,960 | $24,570 |
| 2019 | $2,993 | $37,530 | $12,960 | $24,570 |
| 2018 | $3,058 | $34,070 | $11,210 | $22,860 |
| 2017 | $3,038 | $34,070 | $11,210 | $22,860 |
| 2016 | $2,764 | $29,660 | $13,790 | $15,870 |
| 2015 | $2,770 | $29,660 | $13,790 | $15,870 |
| 2014 | $2,499 | $26,010 | $4,690 | $21,320 |
Source: Public Records
Map
Nearby Homes
- 7723 Suffolk Ave
- 946 Newport Ave
- 554 N Laclede Station Rd
- 570 N Laclede Station Rd
- 4 Saint Charles Place
- 4126 Exeter Ave
- 6 Saint Charles Place
- 4121 Shrewsbury Ave
- 7826 Grove Ave
- 7512 Suffolk Ave
- 25 Saint Charles Place
- 1045 Tuxedo Blvd
- 544 Summit Ave
- 808 Greeley Ave
- 1048 Kuhlman Ln
- 1052 Kuhlman Ln
- 940 Brookside Ave
- 400 Marion Ave
- 1088 Key Ave W
- 5000 Wilshusen Ave
- 441 N Laclede Station Rd
- 455 N Laclede Station Rd
- 401 N Laclede Station Rd
- 7848 Big Bend Blvd
- 7844 Big Bend Blvd
- 7838 Big Bend Blvd
- 325 N Laclede Station Rd
- 7852 Big Bend Blvd
- 7856 Big Bend Blvd
- 321 N Laclede Station Rd
- 7746 Suffolk Ave
- 7860 Big Bend Blvd
- 7744 Suffolk Ave
- 400 N Laclede Station Rd
- 7742 Suffolk Ave
- 7735 Suffolk Ave
- 315 N Laclede Station Rd
- 7864 Big Bend Blvd
- 7841 Big Bend Blvd
- 7851 Big Bend Blvd