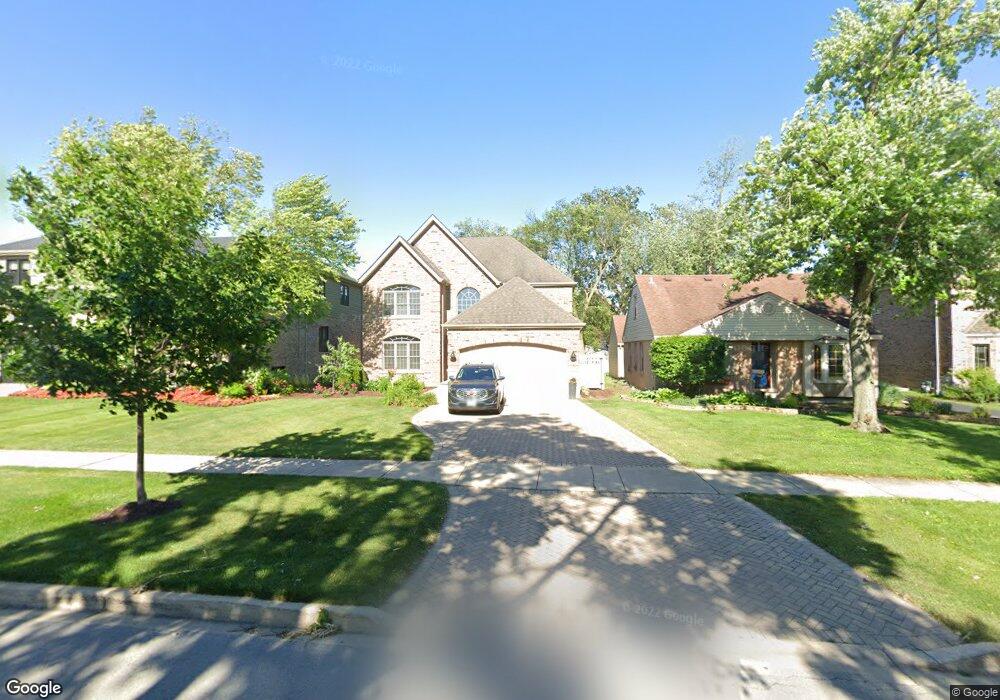
439 N Maple Ave Elmhurst, IL 60126
Estimated Value: $1,032,137 - $1,190,000
Studio
1
Bath
3,396
Sq Ft
$329/Sq Ft
Est. Value
About This Home
This home is located at 439 N Maple Ave, Elmhurst, IL 60126 and is currently estimated at $1,115,784, approximately $328 per square foot. 439 N Maple Ave is a home located in DuPage County with nearby schools including Emerson Elementary School, Churchville Middle School, and York Community High School.
Ownership History
Date
Name
Owned For
Owner Type
Purchase Details
Closed on
Jul 5, 2000
Sold by
Russo Mark S and Russo Wendy
Bought by
Russo Mark S and Russo Wendy
Current Estimated Value
Purchase Details
Closed on
Aug 30, 1999
Sold by
Libert John B and Libert Kim E
Bought by
Russo Mark S and Rudolph Wendy
Home Financials for this Owner
Home Financials are based on the most recent Mortgage that was taken out on this home.
Original Mortgage
$164,800
Outstanding Balance
$48,107
Interest Rate
7.62%
Estimated Equity
$1,067,677
Purchase Details
Closed on
Jul 24, 1996
Sold by
Fleming Jeffrey M and Fleming Michelle M
Bought by
Libert John B and Libert Kim E
Home Financials for this Owner
Home Financials are based on the most recent Mortgage that was taken out on this home.
Original Mortgage
$132,600
Interest Rate
8.33%
Mortgage Type
Balloon
Create a Home Valuation Report for This Property
The Home Valuation Report is an in-depth analysis detailing your home's value as well as a comparison with similar homes in the area
Home Values in the Area
Average Home Value in this Area
Purchase History
| Date | Buyer | Sale Price | Title Company |
|---|---|---|---|
| Russo Mark S | -- | Chicago Title Insurance Co | |
| Russo Mark S | $206,000 | -- | |
| Libert John B | $156,000 | -- |
Source: Public Records
Mortgage History
| Date | Status | Borrower | Loan Amount |
|---|---|---|---|
| Open | Russo Mark S | $164,800 | |
| Previous Owner | Libert John B | $132,600 |
Source: Public Records
Tax History
| Year | Tax Paid | Tax Assessment Tax Assessment Total Assessment is a certain percentage of the fair market value that is determined by local assessors to be the total taxable value of land and additions on the property. | Land | Improvement |
|---|---|---|---|---|
| 2024 | $18,214 | $305,422 | $70,816 | $234,606 |
| 2023 | $16,835 | $280,770 | $65,100 | $215,670 |
| 2022 | $16,546 | $276,110 | $62,300 | $213,810 |
| 2021 | $15,853 | $264,470 | $59,670 | $204,800 |
| 2020 | $14,930 | $253,320 | $57,150 | $196,170 |
| 2019 | $14,720 | $243,570 | $54,950 | $188,620 |
| 2018 | $13,955 | $229,940 | $52,340 | $177,600 |
| 2017 | $13,697 | $219,760 | $50,020 | $169,740 |
| 2016 | $13,148 | $202,900 | $46,180 | $156,720 |
| 2015 | $12,919 | $186,520 | $42,660 | $143,860 |
| 2014 | $12,414 | $165,440 | $35,200 | $130,240 |
| 2013 | $12,355 | $168,820 | $35,920 | $132,900 |
Source: Public Records
Map
Nearby Homes
- 456 N Elm Ave
- 270 W Fremont Ave
- 374 N Myrtle Ave
- 557 N Myrtle Ave
- 365 N Walnut St
- 132 E Gladys Ave
- 275 W North Ave
- 367 N Oak St
- 260 N Addison Ave
- 258 N Addison Ave
- 256 N Addison Ave
- 254 N Addison Ave
- 183 E Grantley Ave
- 142 W 3rd St
- 468 N Highland Ave
- 322 N Highland Ave
- 210 N Addison Ave Unit 301N
- 195 N Addison Ave Unit PH03
- 286 N Indiana St
- 234 E Grantley Ave
- 435 N Maple Ave
- 445 N Maple Ave
- 433 N Maple Ave
- 447 N Maple Ave
- 429 N Maple Ave
- 451 N Maple Ave
- 427 N Maple Ave
- 444 N Larch Ave
- 430 N Maple Ave
- 436 N Larch Ave
- 438 N Maple Ave
- 434 N Maple Ave
- 455 N Maple Ave
- 448 N Larch Ave
- 421 N Maple Ave
- 434 N Larch Ave
- 430 N Larch Ave
- 446 N Maple Ave
- 428 N Maple Ave
- 452 N Larch Ave
Your Personal Tour Guide
Ask me questions while you tour the home.