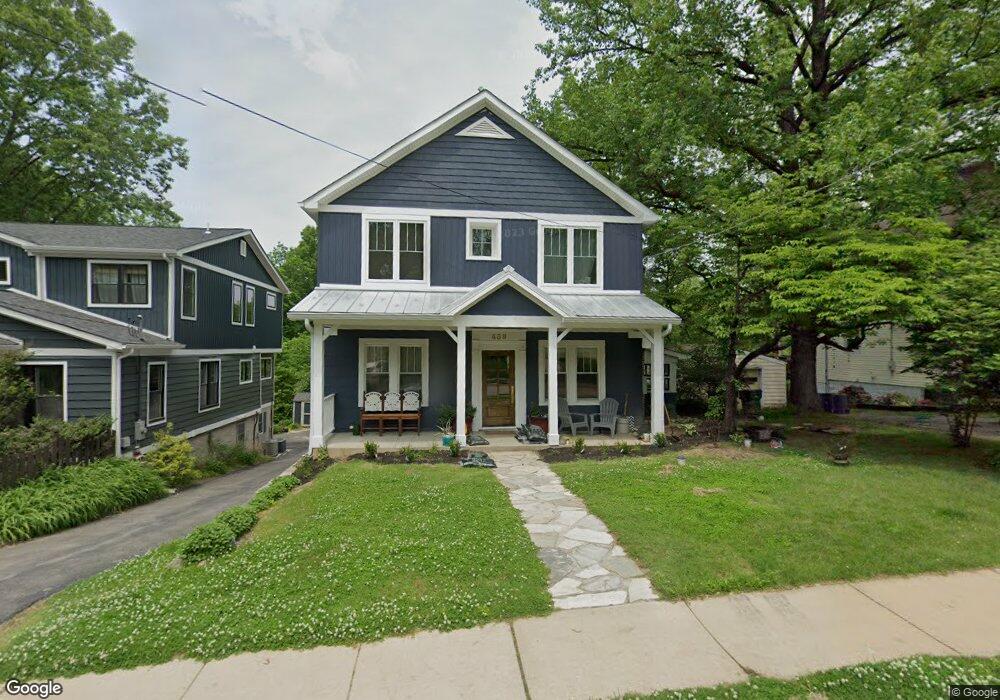
439 Oak St Saint Louis, MO 63119
Estimated Value: $331,000 - $653,000
2
Beds
2
Baths
1,060
Sq Ft
$473/Sq Ft
Est. Value
About This Home
This home is located at 439 Oak St, Saint Louis, MO 63119 and is currently estimated at $501,334, approximately $472 per square foot. 439 Oak St is a home located in St. Louis County with nearby schools including Bristol Elementary School, Hixson Middle School, and Webster Groves High School.
Ownership History
Date
Name
Owned For
Owner Type
Purchase Details
Closed on
Nov 17, 2022
Sold by
Hughes Todd
Bought by
Hughes Todd
Current Estimated Value
Home Financials for this Owner
Home Financials are based on the most recent Mortgage that was taken out on this home.
Original Mortgage
$367,500
Outstanding Balance
$354,911
Interest Rate
7.08%
Mortgage Type
New Conventional
Estimated Equity
$146,423
Purchase Details
Closed on
Jul 23, 2010
Sold by
Hirner Dustin J and Hirner Lisa N
Bought by
Hughes Todd and Hughes Brandy
Home Financials for this Owner
Home Financials are based on the most recent Mortgage that was taken out on this home.
Original Mortgage
$141,804
Interest Rate
4.76%
Mortgage Type
New Conventional
Purchase Details
Closed on
Nov 23, 2005
Sold by
Johnson Elsie R
Bought by
Hirner Dustin J and Hirner Lisa N
Home Financials for this Owner
Home Financials are based on the most recent Mortgage that was taken out on this home.
Original Mortgage
$142,000
Interest Rate
6.12%
Mortgage Type
Fannie Mae Freddie Mac
Create a Home Valuation Report for This Property
The Home Valuation Report is an in-depth analysis detailing your home's value as well as a comparison with similar homes in the area
Home Values in the Area
Average Home Value in this Area
Purchase History
| Date | Buyer | Sale Price | Title Company |
|---|---|---|---|
| Hughes Todd | -- | -- | |
| Hughes Todd | $157,560 | Sec | |
| Hirner Dustin J | $142,000 | -- |
Source: Public Records
Mortgage History
| Date | Status | Borrower | Loan Amount |
|---|---|---|---|
| Open | Hughes Todd | $367,500 | |
| Previous Owner | Hughes Todd | $141,804 | |
| Previous Owner | Hirner Dustin J | $142,000 |
Source: Public Records
Tax History
| Year | Tax Paid | Tax Assessment Tax Assessment Total Assessment is a certain percentage of the fair market value that is determined by local assessors to be the total taxable value of land and additions on the property. | Land | Improvement |
|---|---|---|---|---|
| 2025 | $5,971 | $93,710 | $39,010 | $54,700 |
| 2024 | $5,971 | $85,900 | $31,200 | $54,700 |
| 2023 | $5,971 | $85,900 | $31,200 | $54,700 |
| 2022 | $3,210 | $42,790 | $31,200 | $11,590 |
| 2021 | $3,199 | $42,790 | $31,200 | $11,590 |
| 2020 | $3,469 | $43,280 | $31,200 | $12,080 |
| 2019 | $3,444 | $43,280 | $31,200 | $12,080 |
| 2018 | $3,260 | $36,350 | $24,280 | $12,070 |
| 2017 | $3,238 | $36,350 | $24,280 | $12,070 |
| 2016 | $3,194 | $34,350 | $17,330 | $17,020 |
| 2015 | $3,204 | $34,350 | $17,330 | $17,020 |
| 2014 | $3,160 | $32,970 | $11,880 | $21,090 |
Source: Public Records
Map
Nearby Homes
- 430 W Lockwood Ave
- 404 W Kirkham Ave
- 156 Gray Ave
- 617 Lee Ave
- 433 Bismark Ave
- 519 Bismark Ave
- 515 Crestvale Dr
- 418 Yorkshire Place
- 7 Barbre Ct
- 303 Corona Ct
- 617 N Rock Hill Rd
- 619 N Rock Hill Rd
- 529 Barcia Dr
- 24 Willow Oak Ln
- 457 Yorkshire Place
- 10 Kings Pond Rd
- 112 Oakwood Ave
- 9840 Madison Ave
- 207 Oakwood Ave
- 212 W Thornton Ave
Your Personal Tour Guide
Ask me questions while you tour the home.