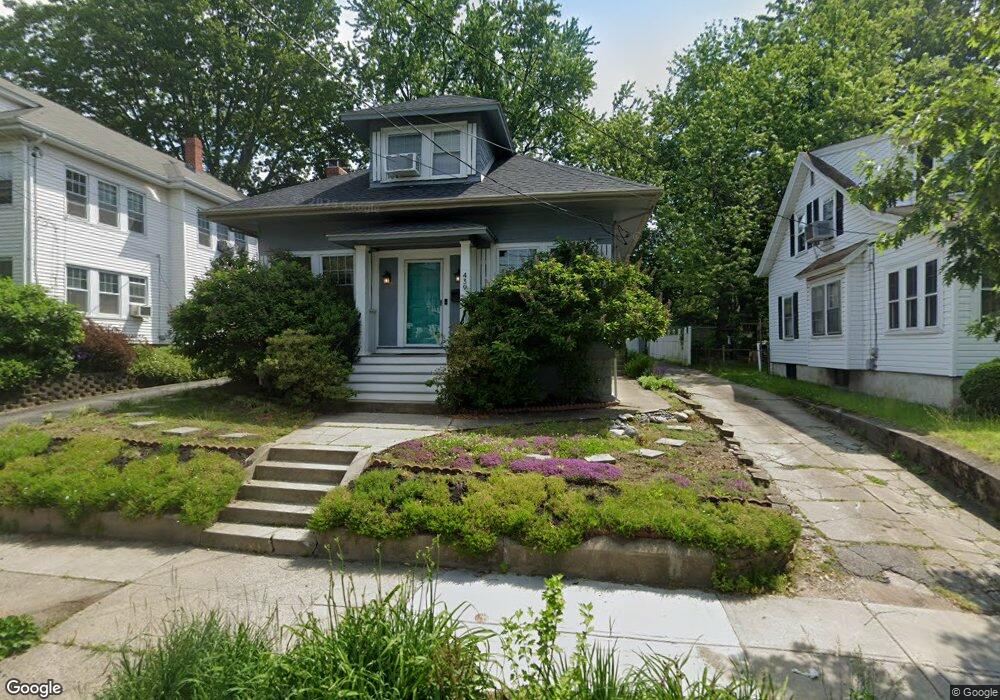
439 River Ave Providence, RI 02908
Elmhurst NeighborhoodEstimated Value: $478,000 - $570,000
5
Beds
3
Baths
2,230
Sq Ft
$235/Sq Ft
Est. Value
About This Home
This home is located at 439 River Ave, Providence, RI 02908 and is currently estimated at $524,086, approximately $235 per square foot. 439 River Ave is a home located in Providence County with nearby schools including St. Pius V Catholic School, St. Augustine School, and Blessed Sacrament School.
Ownership History
Date
Name
Owned For
Owner Type
Purchase Details
Closed on
Dec 21, 2009
Sold by
Topham Judith and Topham Ryan
Bought by
Pinto Liza B
Current Estimated Value
Home Financials for this Owner
Home Financials are based on the most recent Mortgage that was taken out on this home.
Original Mortgage
$192,800
Interest Rate
5%
Mortgage Type
Purchase Money Mortgage
Purchase Details
Closed on
Mar 6, 2009
Sold by
Wells Fargo Bank Na
Bought by
Topham Ryan and Topham Judith
Purchase Details
Closed on
Feb 19, 1997
Sold by
Noonan William J and Noonan Patrricia
Bought by
Laurenceau Reginald and Laurenceau Sherly
Create a Home Valuation Report for This Property
The Home Valuation Report is an in-depth analysis detailing your home's value as well as a comparison with similar homes in the area
Home Values in the Area
Average Home Value in this Area
Purchase History
| Date | Buyer | Sale Price | Title Company |
|---|---|---|---|
| Pinto Liza B | $241,000 | -- | |
| Topham Ryan | $115,000 | -- | |
| Laurenceau Reginald | $94,000 | -- |
Source: Public Records
Mortgage History
| Date | Status | Borrower | Loan Amount |
|---|---|---|---|
| Open | Laurenceau Reginald | $183,000 | |
| Closed | Laurenceau Reginald | $192,800 |
Source: Public Records
Tax History
| Year | Tax Paid | Tax Assessment Tax Assessment Total Assessment is a certain percentage of the fair market value that is determined by local assessors to be the total taxable value of land and additions on the property. | Land | Improvement |
|---|---|---|---|---|
| 2025 | $3,366 | $400,700 | $166,000 | $234,700 |
| 2024 | $5,727 | $312,100 | $107,900 | $204,200 |
| 2023 | $5,727 | $312,100 | $107,900 | $204,200 |
| 2022 | $5,555 | $312,100 | $107,900 | $204,200 |
| 2021 | $6,017 | $245,000 | $88,200 | $156,800 |
| 2020 | $6,017 | $245,000 | $88,200 | $156,800 |
| 2019 | $5,914 | $240,800 | $88,200 | $152,600 |
| 2018 | $5,881 | $184,000 | $70,900 | $113,100 |
| 2017 | $5,881 | $184,000 | $70,900 | $113,100 |
| 2016 | $5,881 | $184,000 | $70,900 | $113,100 |
| 2015 | $4,995 | $150,900 | $70,900 | $80,000 |
| 2014 | $5,093 | $150,900 | $70,900 | $80,000 |
| 2013 | $5,093 | $150,900 | $70,900 | $80,000 |
Source: Public Records
Map
Nearby Homes
Your Personal Tour Guide
Ask me questions while you tour the home.