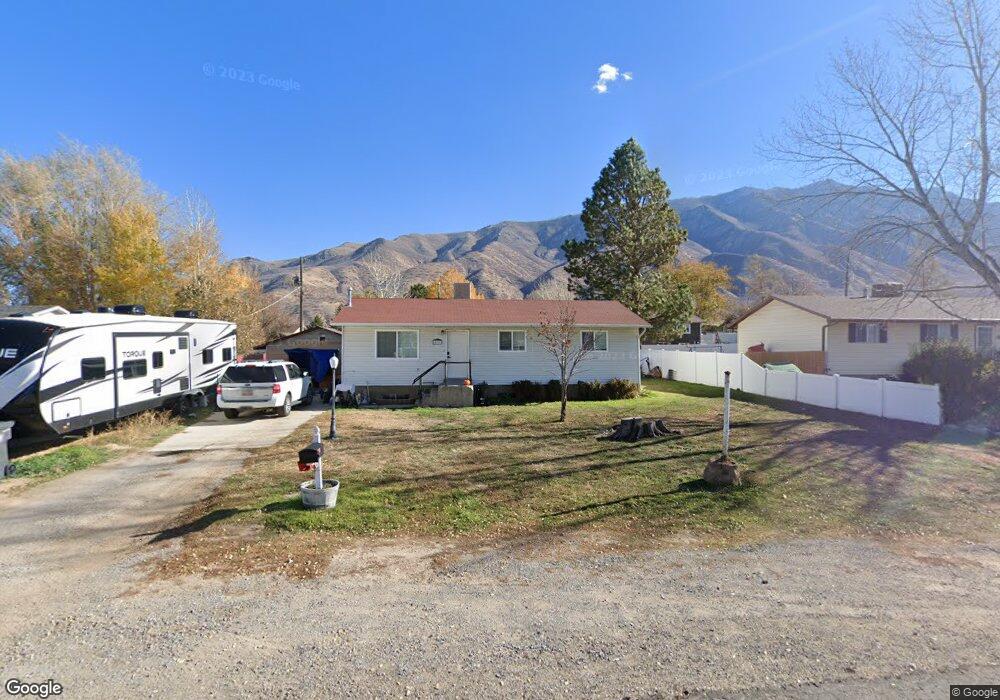
439 S 300 E Santaquin, UT 84655
Estimated Value: $407,929 - $413,000
3
Beds
2
Baths
1,008
Sq Ft
$407/Sq Ft
Est. Value
About This Home
This home is located at 439 S 300 E, Santaquin, UT 84655 and is currently estimated at $410,643, approximately $407 per square foot. 439 S 300 E is a home located in Utah County with nearby schools including Orchard Hills Elementary School, Payson Junior High School, and Mt. Nebo Middle.
Ownership History
Date
Name
Owned For
Owner Type
Purchase Details
Closed on
Jan 12, 2024
Sold by
Cope Rose Marie
Bought by
Humphrey Jennifer and Cope Stephen
Current Estimated Value
Home Financials for this Owner
Home Financials are based on the most recent Mortgage that was taken out on this home.
Original Mortgage
$240,000
Outstanding Balance
$235,577
Interest Rate
6.95%
Mortgage Type
New Conventional
Estimated Equity
$175,066
Purchase Details
Closed on
Jun 20, 2018
Sold by
Jorgensen Glade and Jorgensen Alice Cleo
Bought by
Ware Michael and Ware Mary Kay
Purchase Details
Closed on
Sep 8, 2000
Sold by
Georgetown Development Inc
Bought by
Roberts Lynda
Home Financials for this Owner
Home Financials are based on the most recent Mortgage that was taken out on this home.
Original Mortgage
$108,567
Interest Rate
8.11%
Create a Home Valuation Report for This Property
The Home Valuation Report is an in-depth analysis detailing your home's value as well as a comparison with similar homes in the area
Home Values in the Area
Average Home Value in this Area
Purchase History
| Date | Buyer | Sale Price | Title Company |
|---|---|---|---|
| Humphrey Jennifer | -- | Inwest Title | |
| Ware Michael | -- | Vanguard Titel Ins Agency | |
| Roberts Lynda | -- | First American Title Co |
Source: Public Records
Mortgage History
| Date | Status | Borrower | Loan Amount |
|---|---|---|---|
| Open | Humphrey Jennifer | $240,000 | |
| Previous Owner | Roberts Lynda | $108,567 |
Source: Public Records
Tax History
| Year | Tax Paid | Tax Assessment Tax Assessment Total Assessment is a certain percentage of the fair market value that is determined by local assessors to be the total taxable value of land and additions on the property. | Land | Improvement |
|---|---|---|---|---|
| 2025 | $1,882 | $206,415 | -- | -- |
| 2024 | $1,882 | $187,440 | $0 | $0 |
| 2023 | $1,948 | $194,645 | $0 | $0 |
| 2022 | $1,818 | $187,330 | $0 | $0 |
| 2021 | $1,526 | $243,700 | $74,200 | $169,500 |
| 2020 | $505 | $225,200 | $64,500 | $160,700 |
| 2019 | $1,267 | $200,600 | $60,900 | $139,700 |
| 2018 | $1,185 | $178,800 | $57,300 | $121,500 |
| 2017 | $1,199 | $96,690 | $0 | $0 |
| 2016 | $1,124 | $88,825 | $0 | $0 |
| 2015 | $1,026 | $79,530 | $0 | $0 |
| 2014 | $966 | $78,705 | $0 | $0 |
Source: Public Records
Map
Nearby Homes
Your Personal Tour Guide
Ask me questions while you tour the home.