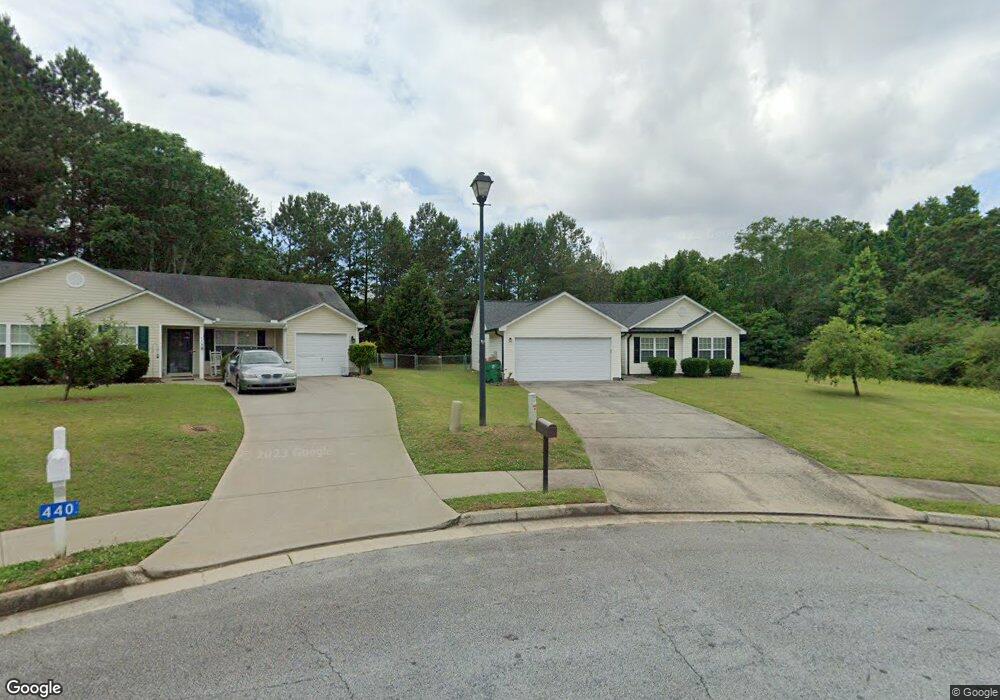
439 Shenandoah Ct Unit 3 Winder, GA 30680
Estimated Value: $292,000 - $309,158
3
Beds
2
Baths
1,282
Sq Ft
$236/Sq Ft
Est. Value
About This Home
This home is located at 439 Shenandoah Ct Unit 3, Winder, GA 30680 and is currently estimated at $302,290, approximately $235 per square foot. 439 Shenandoah Ct Unit 3 is a home located in Barrow County with nearby schools including County Line Elementary School, Russell Middle School, and Winder-Barrow High School.
Ownership History
Date
Name
Owned For
Owner Type
Purchase Details
Closed on
Oct 13, 2008
Sold by
Bagley David R and Bagley Christina M
Bought by
Wilkin Nannette D
Current Estimated Value
Home Financials for this Owner
Home Financials are based on the most recent Mortgage that was taken out on this home.
Original Mortgage
$110,160
Outstanding Balance
$71,328
Interest Rate
5.89%
Mortgage Type
New Conventional
Estimated Equity
$230,962
Purchase Details
Closed on
Sep 14, 2007
Sold by
Secretary Of Hud
Bought by
Bagley David R and Bagley Christina M
Home Financials for this Owner
Home Financials are based on the most recent Mortgage that was taken out on this home.
Original Mortgage
$113,475
Interest Rate
6.62%
Mortgage Type
New Conventional
Purchase Details
Closed on
Apr 3, 2007
Sold by
Midfirst Bk
Bought by
Secretary Of Hud
Purchase Details
Closed on
May 28, 2004
Sold by
Tri-G Prop Inc
Bought by
Berube Kenneth J
Home Financials for this Owner
Home Financials are based on the most recent Mortgage that was taken out on this home.
Original Mortgage
$108,420
Interest Rate
5.89%
Mortgage Type
VA
Purchase Details
Closed on
Nov 3, 2003
Sold by
Shenandoah Partners
Bought by
Tri-G Properties Inc
Purchase Details
Closed on
Jul 22, 2002
Bought by
Shenandoah Partners
Create a Home Valuation Report for This Property
The Home Valuation Report is an in-depth analysis detailing your home's value as well as a comparison with similar homes in the area
Home Values in the Area
Average Home Value in this Area
Purchase History
| Date | Buyer | Sale Price | Title Company |
|---|---|---|---|
| Wilkin Nannette D | $108,000 | -- | |
| Bagley David R | -- | -- | |
| Secretary Of Hud | -- | -- | |
| Midfirst Bk | $111,503 | -- | |
| Berube Kenneth J | $110,100 | -- | |
| Tri-G Properties Inc | $27,500 | -- | |
| Shenandoah Partners | -- | -- |
Source: Public Records
Mortgage History
| Date | Status | Borrower | Loan Amount |
|---|---|---|---|
| Open | Wilkin Nannette D | $110,160 | |
| Previous Owner | Bagley David R | $113,475 | |
| Previous Owner | Berube Kenneth J | $108,420 |
Source: Public Records
Tax History Compared to Growth
Tax History
| Year | Tax Paid | Tax Assessment Tax Assessment Total Assessment is a certain percentage of the fair market value that is determined by local assessors to be the total taxable value of land and additions on the property. | Land | Improvement |
|---|---|---|---|---|
| 2024 | $2,699 | $98,489 | $23,200 | $75,289 |
| 2023 | $2,849 | $88,968 | $22,000 | $66,968 |
| 2022 | $2,377 | $72,470 | $16,000 | $56,470 |
| 2021 | $1,867 | $58,010 | $14,000 | $44,010 |
| 2020 | $1,681 | $52,895 | $12,000 | $40,895 |
| 2019 | $1,704 | $52,895 | $12,000 | $40,895 |
| 2018 | $1,532 | $46,071 | $10,000 | $36,071 |
| 2017 | $1,090 | $36,520 | $10,000 | $26,520 |
| 2016 | $1,035 | $34,412 | $10,000 | $24,412 |
| 2015 | $1,045 | $34,679 | $10,000 | $24,679 |
| 2014 | $898 | $31,022 | $6,076 | $24,946 |
| 2013 | -- | $29,799 | $6,076 | $23,723 |
Source: Public Records
Map
Nearby Homes
- 439 Shenandoah Ct
- 440 Shenandoah Ct Unit 3
- 440 Shenandoah Ct
- 438 Shenandoah Ct Unit 3
- 437 Shenandoah Ct Unit 37
- 437 Shenandoah Ct
- 437 Shenandoah Ct Unit 3
- 436 Shenandoah Ct
- 435 Shenandoah Ct Unit GA 126
- 435 Shenandoah Ct
- 435 Shenandoah Ct Unit GA 12659
- 434 Shenandoah Ct Unit 3
- 434 Shenandoah Ct
- 433 Shenandoah Ct Unit 3
- 432 Shenandoah Ct Unit 3
- 394 Saint Ives Trail Unit 64
- 394 Saint Ives Trail Unit 54
- 394 Saint Ives Trail
- 431 Shenandoah Ct
- 430 Shenandoah Ct