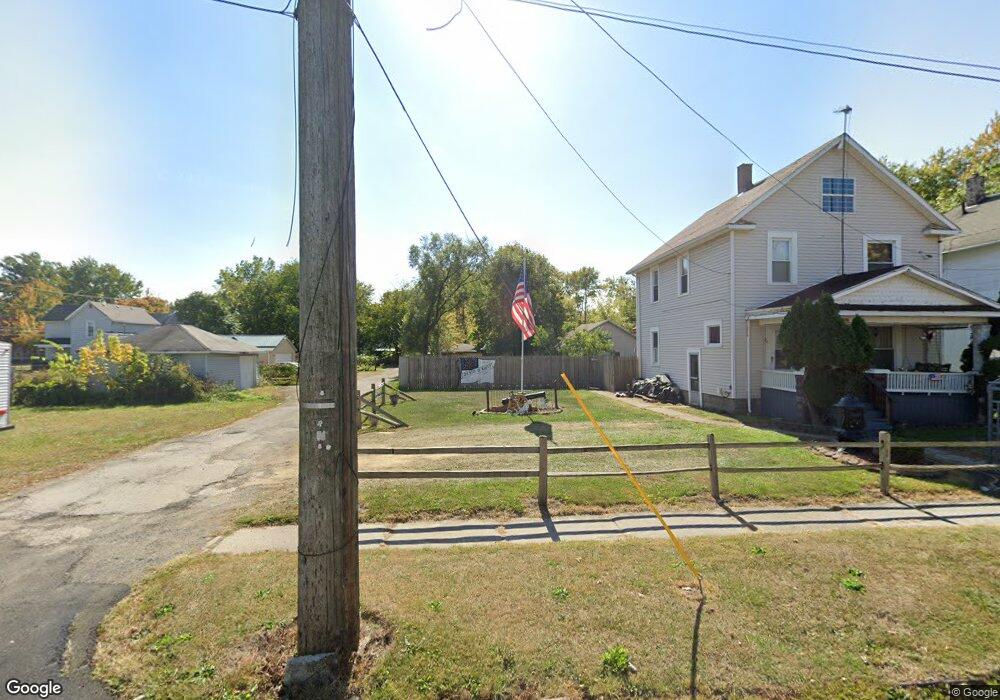
439 Silver St Marion, OH 43302
Estimated Value: $71,000 - $143,000
2
Beds
2
Baths
1,631
Sq Ft
$63/Sq Ft
Est. Value
About This Home
This home is located at 439 Silver St, Marion, OH 43302 and is currently estimated at $102,333, approximately $62 per square foot. 439 Silver St is a home located in Marion County with nearby schools including Rutherford B. Hayes Elementary School, Ulysses S. Grant Middle School, and Harding High School.
Ownership History
Date
Name
Owned For
Owner Type
Purchase Details
Closed on
Oct 25, 2021
Sold by
Marion County Land Reutilization Corp
Bought by
Hicks Harold C
Current Estimated Value
Purchase Details
Closed on
Apr 10, 2006
Sold by
Orcena Lawrence T and Orcena Lowana B
Bought by
Hagerman Michael E
Home Financials for this Owner
Home Financials are based on the most recent Mortgage that was taken out on this home.
Original Mortgage
$63,000
Interest Rate
9.87%
Mortgage Type
Adjustable Rate Mortgage/ARM
Create a Home Valuation Report for This Property
The Home Valuation Report is an in-depth analysis detailing your home's value as well as a comparison with similar homes in the area
Home Values in the Area
Average Home Value in this Area
Purchase History
| Date | Buyer | Sale Price | Title Company |
|---|---|---|---|
| Hicks Harold C | -- | None Available | |
| Hagerman Michael E | $49,800 | None Available |
Source: Public Records
Mortgage History
| Date | Status | Borrower | Loan Amount |
|---|---|---|---|
| Previous Owner | Hagerman Michael E | $63,000 |
Source: Public Records
Tax History Compared to Growth
Tax History
| Year | Tax Paid | Tax Assessment Tax Assessment Total Assessment is a certain percentage of the fair market value that is determined by local assessors to be the total taxable value of land and additions on the property. | Land | Improvement |
|---|---|---|---|---|
| 2024 | $47 | $1,180 | $1,180 | $0 |
| 2023 | $47 | $1,180 | $1,180 | $0 |
| 2022 | $44 | $1,180 | $1,180 | $0 |
| 2021 | $41 | $1,030 | $1,030 | $0 |
| 2020 | $41 | $1,030 | $1,030 | $0 |
| 2019 | $41 | $1,030 | $1,030 | $0 |
| 2018 | $0 | $960 | $960 | $0 |
| 2017 | $0 | $17,040 | $1,000 | $16,040 |
| 2016 | $680 | $17,040 | $1,000 | $16,040 |
| 2015 | $663 | $16,700 | $960 | $15,740 |
| 2014 | $804 | $16,700 | $960 | $15,740 |
| 2012 | $788 | $19,700 | $1,030 | $18,670 |
Source: Public Records
Map
Nearby Homes
- 343 Commercial St
- 178 Leader St
- 347 Mary St
- 233 Tully St
- 468 Avondale Ave
- 551 Universal Ave Unit 555
- 485 Avondale Ave
- 325 Holmes Place
- 520 Toledo Ave
- 395 N Main St
- 531 Toledo Ave
- 641 Blake Ave
- 374 Nunin Ct
- 636 Mary St
- 552 N Prospect St
- 429 W Columbia St
- 434 N State St
- 213 Sharp St
- 302 Blaine Ave
- 134 Waterloo St