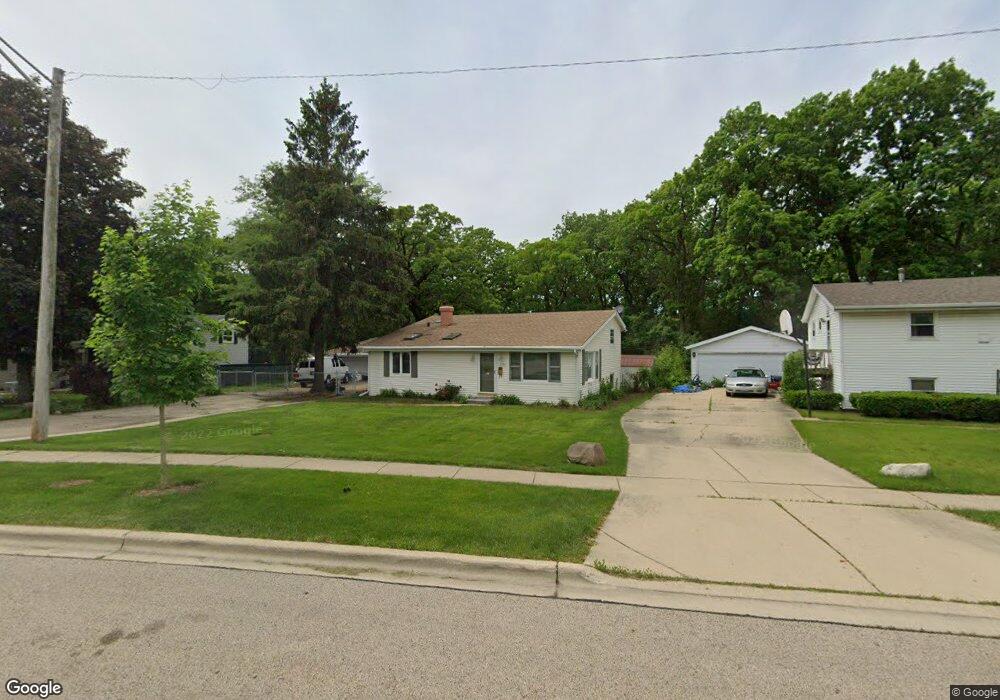
439 Tulsa Ave Carpentersville, IL 60110
Estimated Value: $270,000 - $299,000
4
Beds
1
Bath
1,073
Sq Ft
$266/Sq Ft
Est. Value
About This Home
This home is located at 439 Tulsa Ave, Carpentersville, IL 60110 and is currently estimated at $285,861, approximately $266 per square foot. 439 Tulsa Ave is a home located in Kane County with nearby schools including Lakewood School, Crescent City Grade School, and Carpentersville Middle School.
Ownership History
Date
Name
Owned For
Owner Type
Purchase Details
Closed on
Mar 13, 2025
Sold by
Rodriguez Hiram Lopez and Lugo-Cintron Mayra S
Bought by
Rodriguez Hiram Lopez and Lugo-Cintron Mayra S
Current Estimated Value
Purchase Details
Closed on
Jun 23, 2000
Sold by
Fritz Anthony D and Fritz Alicia M
Bought by
Lopez Hiram and Lugo Cintron Mayra S
Home Financials for this Owner
Home Financials are based on the most recent Mortgage that was taken out on this home.
Original Mortgage
$118,507
Interest Rate
8.56%
Purchase Details
Closed on
Jul 31, 1995
Sold by
Tortorea Anthony P and Tortorea Susan M
Bought by
Fritz Anthony D
Home Financials for this Owner
Home Financials are based on the most recent Mortgage that was taken out on this home.
Original Mortgage
$103,630
Interest Rate
7.51%
Mortgage Type
FHA
Create a Home Valuation Report for This Property
The Home Valuation Report is an in-depth analysis detailing your home's value as well as a comparison with similar homes in the area
Home Values in the Area
Average Home Value in this Area
Purchase History
| Date | Buyer | Sale Price | Title Company |
|---|---|---|---|
| Rodriguez Hiram Lopez | -- | None Listed On Document | |
| Lopez Hiram | $122,000 | Chicago Title Insurance Co | |
| Fritz Anthony D | $104,500 | Attorneys National Title |
Source: Public Records
Mortgage History
| Date | Status | Borrower | Loan Amount |
|---|---|---|---|
| Previous Owner | Lopez Hiram | $118,507 | |
| Previous Owner | Fritz Anthony D | $103,630 |
Source: Public Records
Tax History Compared to Growth
Tax History
| Year | Tax Paid | Tax Assessment Tax Assessment Total Assessment is a certain percentage of the fair market value that is determined by local assessors to be the total taxable value of land and additions on the property. | Land | Improvement |
|---|---|---|---|---|
| 2024 | $5,583 | $73,722 | $12,553 | $61,169 |
| 2023 | $5,573 | $66,333 | $11,295 | $55,038 |
| 2022 | $5,267 | $60,488 | $11,295 | $49,193 |
| 2021 | $5,174 | $57,113 | $10,665 | $46,448 |
| 2020 | $4,552 | $55,829 | $10,425 | $45,404 |
| 2019 | $4,447 | $52,999 | $9,897 | $43,102 |
| 2018 | $4,242 | $48,747 | $9,701 | $39,046 |
| 2017 | $4,062 | $45,601 | $9,075 | $36,526 |
| 2016 | $3,714 | $39,755 | $8,787 | $30,968 |
| 2015 | -- | $32,965 | $8,234 | $24,731 |
| 2014 | -- | $29,478 | $8,007 | $21,471 |
| 2013 | -- | $30,380 | $8,252 | $22,128 |
Source: Public Records
Map
Nearby Homes