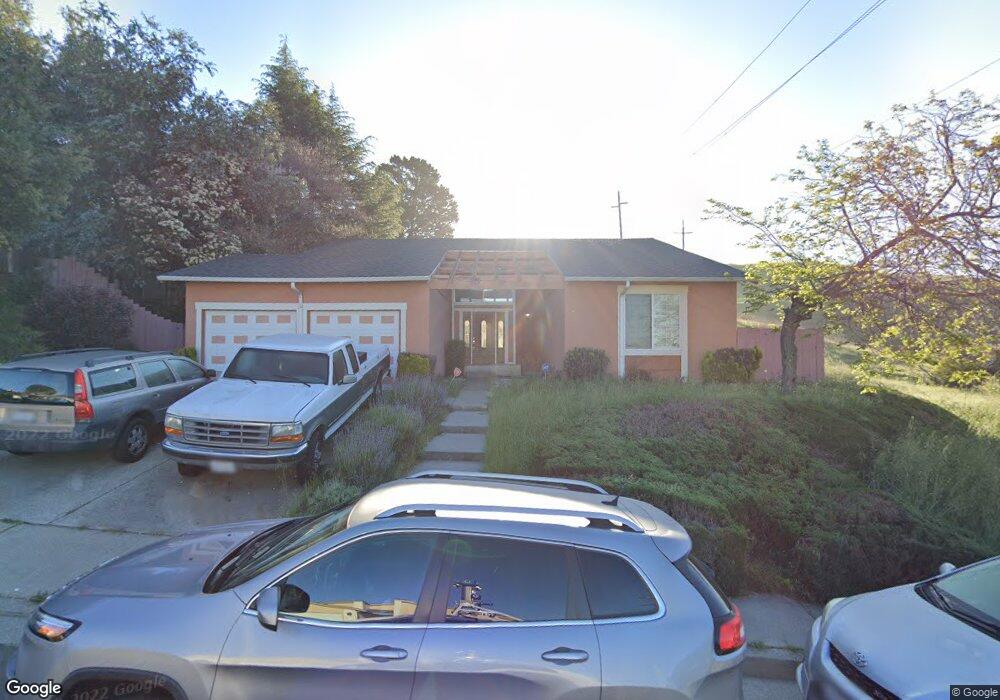
439 Violet Rd Hercules, CA 94547
Estimated Value: $696,000 - $798,000
4
Beds
2
Baths
1,673
Sq Ft
$458/Sq Ft
Est. Value
About This Home
This home is located at 439 Violet Rd, Hercules, CA 94547 and is currently estimated at $765,427, approximately $457 per square foot. 439 Violet Rd is a home located in Contra Costa County with nearby schools including Lupine Hills Elementary School, Hercules Middle School, and Hercules High School.
Ownership History
Date
Name
Owned For
Owner Type
Purchase Details
Closed on
May 27, 2011
Sold by
Federal Home Loan Mortgage Corporation
Bought by
Yeung Wai Kwan
Current Estimated Value
Purchase Details
Closed on
Jan 11, 2011
Sold by
Choy Yuk Mei and Hong Choi U
Bought by
Federal Home Loan Mortgage Corporation
Purchase Details
Closed on
Sep 5, 2006
Sold by
Young Clifford
Bought by
Choy Yuk Mei and Hong Choi U
Purchase Details
Closed on
Jun 21, 2000
Sold by
Vonhueck Rommell
Bought by
Hueck Sandra Patricia
Create a Home Valuation Report for This Property
The Home Valuation Report is an in-depth analysis detailing your home's value as well as a comparison with similar homes in the area
Home Values in the Area
Average Home Value in this Area
Purchase History
| Date | Buyer | Sale Price | Title Company |
|---|---|---|---|
| Yeung Wai Kwan | $289,500 | First American Title Ins Co | |
| Federal Home Loan Mortgage Corporation | $331,143 | None Available | |
| Choy Yuk Mei | $375,000 | Chicago Title Co | |
| Choi Lawrence U F | -- | Chicago Title Co | |
| Hueck Sandra Patricia | -- | United Title |
Source: Public Records
Tax History
| Year | Tax Paid | Tax Assessment Tax Assessment Total Assessment is a certain percentage of the fair market value that is determined by local assessors to be the total taxable value of land and additions on the property. | Land | Improvement |
|---|---|---|---|---|
| 2025 | $6,529 | $370,886 | $192,170 | $178,716 |
| 2024 | $6,130 | $363,614 | $188,402 | $175,212 |
| 2023 | $6,130 | $356,485 | $184,708 | $171,777 |
| 2022 | $6,060 | $349,496 | $181,087 | $168,409 |
| 2021 | $6,051 | $342,644 | $177,537 | $165,107 |
| 2019 | $5,758 | $332,483 | $172,272 | $160,211 |
| 2018 | $5,599 | $325,965 | $168,895 | $157,070 |
| 2017 | $5,518 | $319,575 | $165,584 | $153,991 |
| 2016 | $5,360 | $313,310 | $162,338 | $150,972 |
| 2015 | $5,368 | $308,605 | $159,900 | $148,705 |
| 2014 | $5,358 | $302,561 | $156,768 | $145,793 |
Source: Public Records
Map
Nearby Homes
- 139 Farragut St
- 2142 Redwood Rd
- 161 Seaway Ct
- 248 Carson St
- 103 Tuscany Ct
- 256 Napoli Ct Unit 256
- 134 Caprice Cir
- 2 Knoll Ct
- 1086 Canterbury
- 405 Weymouth
- 704 Windsor Unit 704
- 158 Bedford
- 1101 Chelsea
- 176 Bedford
- 2810 Wright Ave
- 900 Seascape Cir
- 1723 Pheasant Dr
- 983 Seascape Cir
- 2555 Arroyo Ave
- 836 Hawthorne Dr
Your Personal Tour Guide
Ask me questions while you tour the home.