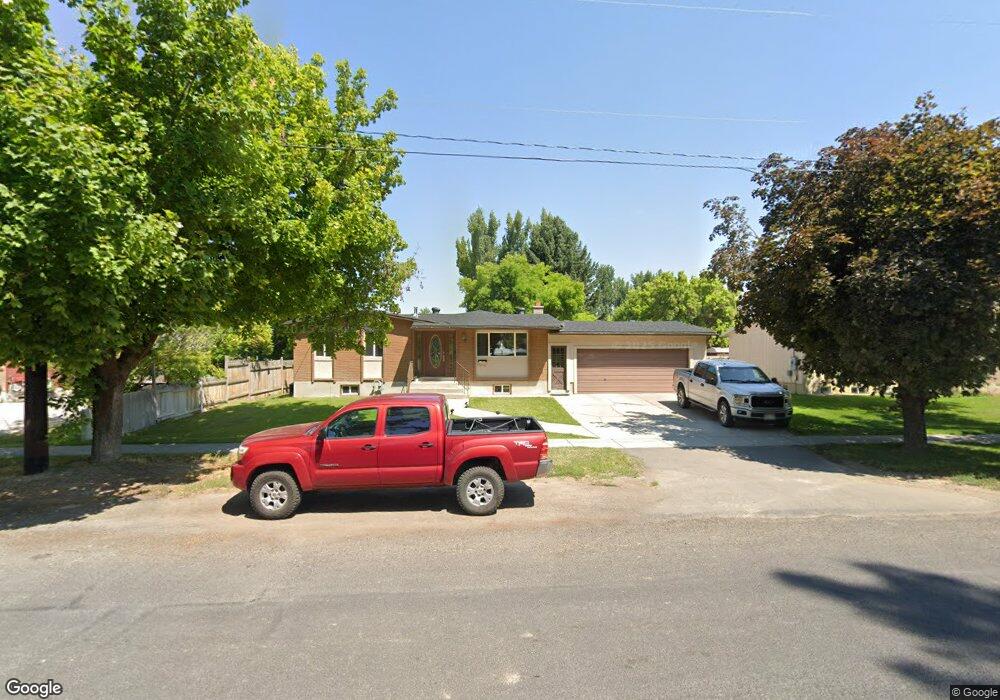
439 W 400 S Logan, UT 84321
Woodruff NeighborhoodEstimated Value: $399,000 - $482,000
3
Beds
2
Baths
2,206
Sq Ft
$193/Sq Ft
Est. Value
About This Home
This home is located at 439 W 400 S, Logan, UT 84321 and is currently estimated at $425,719, approximately $192 per square foot. 439 W 400 S is a home located in Cache County with nearby schools including Woodruff School, Mount Logan Middle School, and Logan High School.
Ownership History
Date
Name
Owned For
Owner Type
Purchase Details
Closed on
Jul 27, 2017
Sold by
Honey Roger G
Bought by
Torres Adrian and Mejia Veronica
Current Estimated Value
Home Financials for this Owner
Home Financials are based on the most recent Mortgage that was taken out on this home.
Original Mortgage
$211,105
Outstanding Balance
$175,451
Interest Rate
3.99%
Mortgage Type
FHA
Estimated Equity
$250,268
Purchase Details
Closed on
Jul 26, 2017
Sold by
Folsom Elaine Winn
Bought by
Torres Adrian and Mejia Veronica
Home Financials for this Owner
Home Financials are based on the most recent Mortgage that was taken out on this home.
Original Mortgage
$211,105
Outstanding Balance
$175,451
Interest Rate
3.99%
Mortgage Type
FHA
Estimated Equity
$250,268
Purchase Details
Closed on
Jun 9, 2017
Sold by
Gutke Barbara W
Bought by
Gh Real Estate Lc
Home Financials for this Owner
Home Financials are based on the most recent Mortgage that was taken out on this home.
Original Mortgage
$211,105
Outstanding Balance
$175,451
Interest Rate
3.99%
Mortgage Type
FHA
Estimated Equity
$250,268
Purchase Details
Closed on
Mar 13, 2017
Sold by
Johnson Karoline
Bought by
Folsom Elaine Winn and Honey Roger G
Purchase Details
Closed on
Feb 10, 2017
Sold by
Johnson Karolyne and Johnson Karoline
Bought by
Gurke Barbara W
Purchase Details
Closed on
Nov 4, 2011
Sold by
Covert Jalynn H and Johnson Janalee H
Bought by
Monroe Trevor Ray
Home Financials for this Owner
Home Financials are based on the most recent Mortgage that was taken out on this home.
Original Mortgage
$159,354
Interest Rate
4.02%
Mortgage Type
VA
Purchase Details
Closed on
Mar 2, 2006
Sold by
Heaps Lynn R and Heaps Jolene M
Bought by
Heaps Lynn R and Heaps Jolene M
Home Financials for this Owner
Home Financials are based on the most recent Mortgage that was taken out on this home.
Original Mortgage
$88,000
Interest Rate
6.08%
Mortgage Type
New Conventional
Purchase Details
Closed on
Aug 22, 2001
Sold by
Heaps Lynn R and Heaps Jolene
Bought by
Heaps Lynn R and Heaps Jolene M
Create a Home Valuation Report for This Property
The Home Valuation Report is an in-depth analysis detailing your home's value as well as a comparison with similar homes in the area
Home Values in the Area
Average Home Value in this Area
Purchase History
| Date | Buyer | Sale Price | Title Company |
|---|---|---|---|
| Torres Adrian | -- | None Available | |
| Torres Adrian | -- | None Available | |
| Gh Real Estate Lc | -- | Advanced Title | |
| Folsom Elaine Winn | -- | None Available | |
| Gurke Barbara W | -- | Northern Title Company | |
| Monroe Trevor Ray | -- | Cache Title Company | |
| Heaps Lynn R | -- | Hickman Land Title Company | |
| Heaps Lynn R | -- | Hickman Land Title Company | |
| Heaps Lynn R | -- | -- |
Source: Public Records
Mortgage History
| Date | Status | Borrower | Loan Amount |
|---|---|---|---|
| Open | Torres Adrian | $211,105 | |
| Closed | Torres Adrian | $211,105 | |
| Previous Owner | Monroe Trevor Ray | $159,354 | |
| Previous Owner | Heaps Lynn R | $88,000 |
Source: Public Records
Tax History
| Year | Tax Paid | Tax Assessment Tax Assessment Total Assessment is a certain percentage of the fair market value that is determined by local assessors to be the total taxable value of land and additions on the property. | Land | Improvement |
|---|---|---|---|---|
| 2025 | $1,812 | $234,410 | $0 | $0 |
| 2024 | $1,861 | $233,125 | $0 | $0 |
| 2023 | $1,933 | $230,850 | $0 | $0 |
| 2022 | $1,759 | $196,120 | $0 | $0 |
| 2021 | $1,656 | $285,330 | $47,850 | $237,480 |
| 2020 | $1,585 | $245,750 | $47,850 | $197,900 |
| 2019 | $1,443 | $213,975 | $47,850 | $166,125 |
| 2018 | $1,393 | $188,634 | $47,850 | $140,784 |
| 2017 | $1,313 | $93,995 | $0 | $0 |
| 2016 | $1,361 | $93,995 | $0 | $0 |
| 2015 | $1,363 | $93,995 | $0 | $0 |
| 2014 | $1,079 | $82,345 | $0 | $0 |
| 2013 | -- | $82,345 | $0 | $0 |
Source: Public Records
Map
Nearby Homes
Your Personal Tour Guide
Ask me questions while you tour the home.