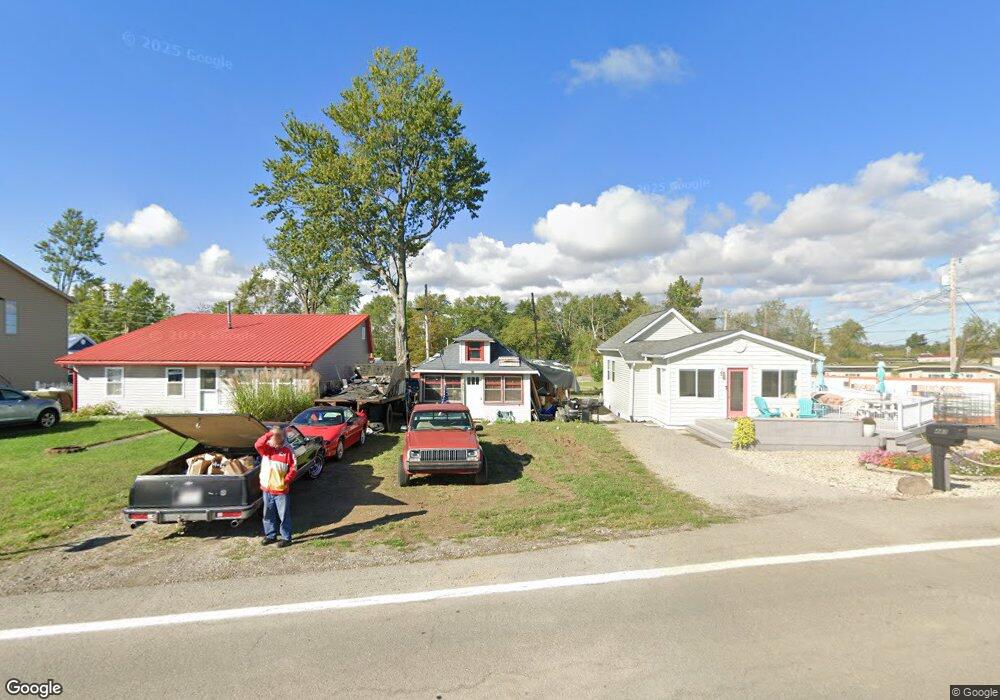
439 W Main St Russells Point, OH 43348
Estimated Value: $79,649 - $160,000
3
Beds
1
Bath
584
Sq Ft
$213/Sq Ft
Est. Value
About This Home
This home is located at 439 W Main St, Russells Point, OH 43348 and is currently estimated at $124,412, approximately $213 per square foot. 439 W Main St is a home located in Logan County with nearby schools including Indian Lake Elementary School, Indian Lake Middle School, and Indian Lake High School.
Ownership History
Date
Name
Owned For
Owner Type
Purchase Details
Closed on
Nov 19, 2024
Sold by
Baker Mary K C Soter and Soter Mary K
Bought by
Soter Mary K C and Soter Roger Craig
Current Estimated Value
Purchase Details
Closed on
Aug 15, 2008
Bought by
Baker James A
Purchase Details
Closed on
Oct 25, 2000
Bought by
Baker James A
Create a Home Valuation Report for This Property
The Home Valuation Report is an in-depth analysis detailing your home's value as well as a comparison with similar homes in the area
Home Values in the Area
Average Home Value in this Area
Purchase History
| Date | Buyer | Sale Price | Title Company |
|---|---|---|---|
| Soter Mary K C | -- | None Listed On Document | |
| Soter Mary K C | -- | None Listed On Document | |
| Baker James A | -- | -- | |
| Baker James A | $8,000 | -- |
Source: Public Records
Tax History Compared to Growth
Tax History
| Year | Tax Paid | Tax Assessment Tax Assessment Total Assessment is a certain percentage of the fair market value that is determined by local assessors to be the total taxable value of land and additions on the property. | Land | Improvement |
|---|---|---|---|---|
| 2024 | $497 | $11,260 | $4,200 | $7,060 |
| 2023 | $497 | $11,260 | $4,200 | $7,060 |
| 2022 | $507 | $9,380 | $3,500 | $5,880 |
| 2021 | $479 | $9,350 | $3,500 | $5,850 |
| 2020 | $1,022 | $8,100 | $2,510 | $5,590 |
| 2019 | $1,014 | $8,100 | $2,510 | $5,590 |
| 2018 | $1,441 | $8,100 | $2,510 | $5,590 |
| 2016 | $1,561 | $7,720 | $2,390 | $5,330 |
| 2014 | $963 | $7,720 | $2,390 | $5,330 |
| 2013 | $963 | $9,050 | $3,720 | $5,330 |
| 2012 | $963 | $7,950 | $1,540 | $6,410 |
Source: Public Records
Map
Nearby Homes
- 134 Brads Way
- 236 2nd St
- 211 W Main St
- 202 W Main St
- 241 Chase Ave Unit B-2-U
- 130 Sunnyside Ave
- 129 Chase Ave Unit 11U
- 202 Grand Ave
- 208 Clermont Ave
- 9713 Mauger St
- 222 Warren Ave Unit 3
- 222 Park Ave
- 9003 Walnut St
- 285 N Orchard Island Rd Unit lot 66
- 8832 Franklin Ave
- 8990 Crescent St
- 8968 Park St
- 8959 Crescent St
- 8946 Maple St
- 8921 Park St