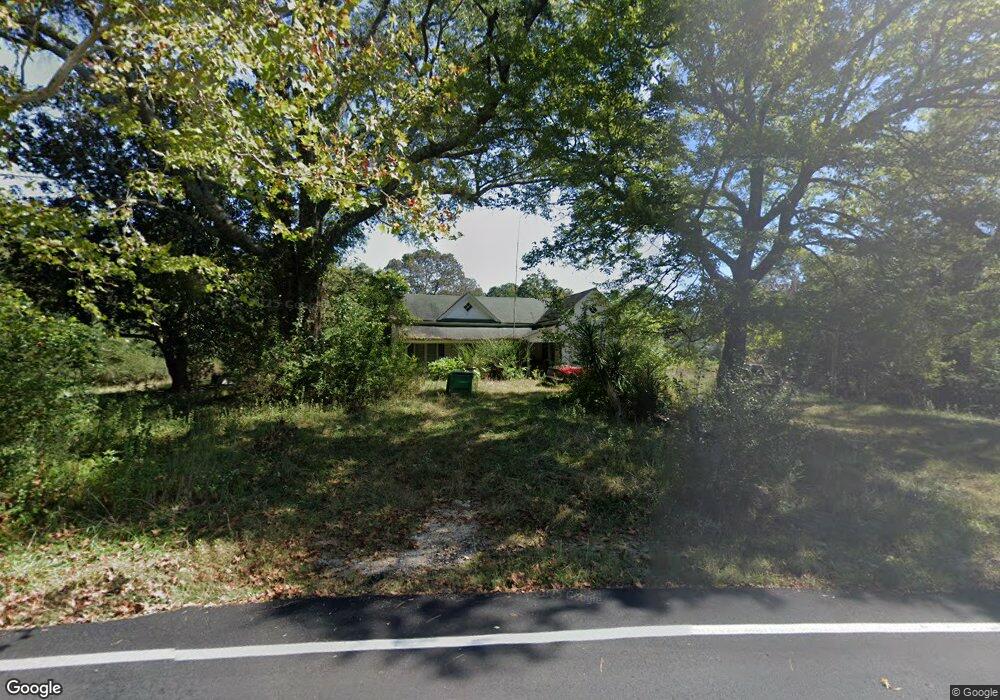
439 Walnut Grove Rd La Fayette, GA 30728
Estimated Value: $314,385 - $362,000
3
Beds
2
Baths
1,752
Sq Ft
$194/Sq Ft
Est. Value
About This Home
This home is located at 439 Walnut Grove Rd, La Fayette, GA 30728 and is currently estimated at $339,346, approximately $193 per square foot. 439 Walnut Grove Rd is a home located in Walker County with nearby schools including Gilbert Elementary School, Lafayette Middle School, and Lafayette High School.
Ownership History
Date
Name
Owned For
Owner Type
Purchase Details
Closed on
Aug 30, 2001
Sold by
First Union Bank For Linda
Bought by
Hannah H Robert
Current Estimated Value
Purchase Details
Closed on
Dec 29, 2000
Sold by
Suggs Todd L and Suggs Tina F
Bought by
Holcombe Sybil and Curley Lee
Purchase Details
Closed on
Aug 19, 1995
Sold by
Jones Gary H and Jones Sharon A
Bought by
Suggs Todd L and Suggs Tina F
Purchase Details
Closed on
Dec 1, 1992
Sold by
Spurgeon James D and Spurgeon Shelia
Bought by
Jones Gary H and Jones Sharon A
Purchase Details
Closed on
Nov 13, 1991
Sold by
Baker Bobby and Baker Paula
Bought by
Spurgeon James D and Spurgeon Shelia
Purchase Details
Closed on
Apr 3, 1987
Sold by
Edwards Alan E and Edwards Cheryl
Bought by
Baker Bobby and Baker Paula
Purchase Details
Closed on
Mar 28, 1978
Sold by
Howard Margie
Bought by
Edwards Alan E and Edwards Cheryl
Purchase Details
Closed on
Jul 2, 1974
Sold by
Howard Mrs and Howard B
Bought by
Howard Margie
Purchase Details
Closed on
Jan 1, 1972
Bought by
Howard Mrs and Howard B
Create a Home Valuation Report for This Property
The Home Valuation Report is an in-depth analysis detailing your home's value as well as a comparison with similar homes in the area
Home Values in the Area
Average Home Value in this Area
Purchase History
| Date | Buyer | Sale Price | Title Company |
|---|---|---|---|
| Hannah H Robert | -- | -- | |
| First Union Bank For Linda | $98,900 | -- | |
| Holcombe Sybil | $109,900 | -- | |
| Suggs Todd L | $39,000 | -- | |
| Jones Gary H | $30,000 | -- | |
| Spurgeon James D | $30,600 | -- | |
| Baker Bobby | $30,000 | -- | |
| Edwards Alan E | -- | -- | |
| Howard Margie | -- | -- | |
| Howard Mrs | -- | -- |
Source: Public Records
Tax History Compared to Growth
Tax History
| Year | Tax Paid | Tax Assessment Tax Assessment Total Assessment is a certain percentage of the fair market value that is determined by local assessors to be the total taxable value of land and additions on the property. | Land | Improvement |
|---|---|---|---|---|
| 2024 | $1,866 | $80,851 | $39,818 | $41,033 |
| 2023 | $1,683 | $70,454 | $31,602 | $38,852 |
| 2022 | $1,307 | $50,060 | $16,735 | $33,325 |
| 2021 | $1,253 | $43,319 | $16,735 | $26,584 |
| 2020 | $1,221 | $40,623 | $16,735 | $23,888 |
| 2019 | $1,241 | $40,623 | $16,735 | $23,888 |
| 2018 | $1,075 | $40,623 | $16,735 | $23,888 |
| 2017 | $1,353 | $40,623 | $16,735 | $23,888 |
| 2016 | $812 | $29,861 | $16,735 | $13,126 |
| 2015 | $1,125 | $40,213 | $18,824 | $21,389 |
| 2014 | $1,029 | $40,213 | $18,824 | $21,389 |
| 2013 | -- | $40,213 | $18,824 | $21,389 |
Source: Public Records
Map
Nearby Homes
- 254 Old Warren School Rd
- 236 Old Warren School Rd
- 224 Old Warren School Rd
- 161 Old Warren School Rd
- 97 Old Warren School Rd
- 67 Old Warren School Rd
- 15 Old Lee School Rd
- 0 Martindale Rd Unit 10608820
- 0 Martindale Rd Unit 1520834
- 0 Ga Hwy 337 Unit LotWP001
- 3523 E Broomtown Rd
- 1144 Ridgeway Rd
- 2280 Highway S 27
- 2280 S Highway S 27
- 1511 Monroe Green Rd
- 1263 Bronco Rd
- 1299 Trion Hwy
- 6671 Highway 337
- 6670 Highway 337
- Curtis Plan at Lake Terrace
- 64 Streeter Dr
- 83 Streeter Dr
- 434 Walnut Grove Rd
- 390 Walnut Grove Rd
- 559 Walnut Grove Rd
- 386 Walnut Grove Rd
- 291 Walnut Grove Rd
- 274 Walnut Grove Rd
- 302 Walnut Grove Rd
- 599 Walnut Grove Rd
- 655 Walnut Grove Rd
- 594 Walnut Grove Rd
- 682 Walnut Grove Rd
- 230 Walnut Grove Rd
- 157 Walnut Grove Rd
- 276 Walnut Grove Rd
- 212 Walnut Grove Ln
- 113 Walnut Grove Rd
- 775 Walnut Grove Rd
- 822 Walnut Grove Rd