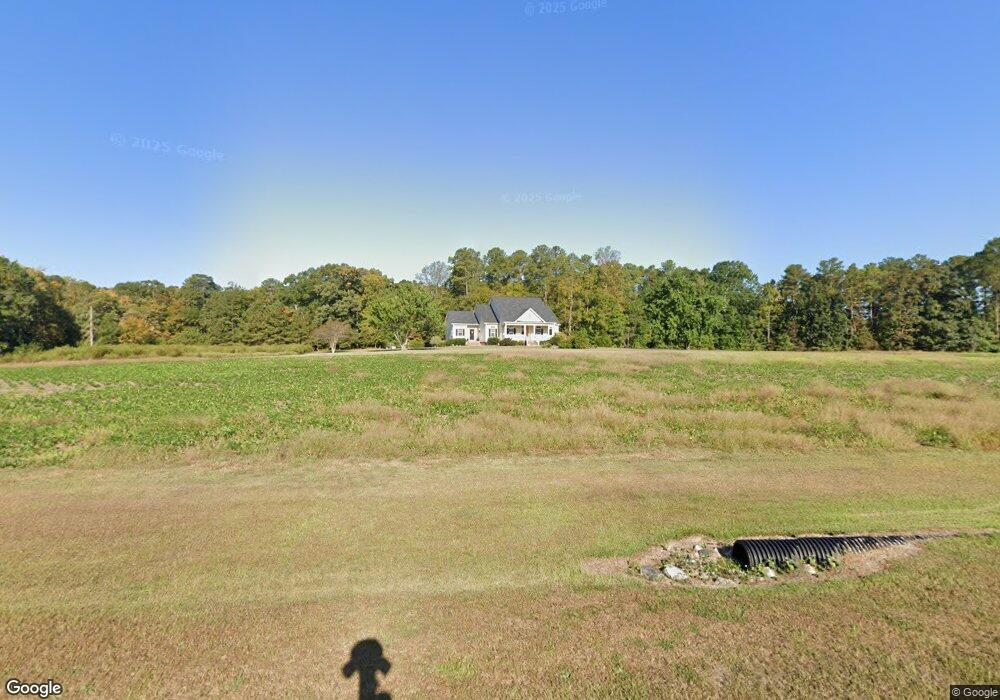
439 Wheless Rd Louisburg, NC 27549
Estimated Value: $376,000 - $501,000
3
Beds
3
Baths
2,086
Sq Ft
$223/Sq Ft
Est. Value
About This Home
This home is located at 439 Wheless Rd, Louisburg, NC 27549 and is currently estimated at $465,378, approximately $223 per square foot. 439 Wheless Rd is a home located in Franklin County with nearby schools including Edward Best Elementary School, Terrell Lane Middle School, and Louisburg High School.
Ownership History
Date
Name
Owned For
Owner Type
Purchase Details
Closed on
Mar 9, 2016
Sold by
Simpson Sean and Simpson Rhona
Bought by
Denton Thomas B and Denton Kimberly B
Current Estimated Value
Home Financials for this Owner
Home Financials are based on the most recent Mortgage that was taken out on this home.
Original Mortgage
$150,000
Outstanding Balance
$118,630
Interest Rate
3.79%
Mortgage Type
Future Advance Clause Open End Mortgage
Estimated Equity
$346,748
Purchase Details
Closed on
Oct 9, 2007
Sold by
Stallings Wesley C and Stallings Dawn M
Bought by
Simpson Sean and Simpson Rhonda
Home Financials for this Owner
Home Financials are based on the most recent Mortgage that was taken out on this home.
Original Mortgage
$289,600
Interest Rate
6.26%
Mortgage Type
New Conventional
Create a Home Valuation Report for This Property
The Home Valuation Report is an in-depth analysis detailing your home's value as well as a comparison with similar homes in the area
Home Values in the Area
Average Home Value in this Area
Purchase History
| Date | Buyer | Sale Price | Title Company |
|---|---|---|---|
| Denton Thomas B | $200,000 | None Available | |
| Simpson Sean | $362,000 | None Available |
Source: Public Records
Mortgage History
| Date | Status | Borrower | Loan Amount |
|---|---|---|---|
| Open | Denton Thomas B | $150,000 | |
| Previous Owner | Simpson Sean | $289,600 |
Source: Public Records
Tax History Compared to Growth
Tax History
| Year | Tax Paid | Tax Assessment Tax Assessment Total Assessment is a certain percentage of the fair market value that is determined by local assessors to be the total taxable value of land and additions on the property. | Land | Improvement |
|---|---|---|---|---|
| 2025 | $2,494 | $402,320 | $136,530 | $265,790 |
| 2024 | $2,494 | $402,320 | $136,530 | $265,790 |
| 2023 | $1,903 | $205,540 | $50,710 | $154,830 |
| 2022 | $1,893 | $205,540 | $50,710 | $154,830 |
| 2021 | $1,914 | $205,540 | $50,710 | $154,830 |
| 2020 | $1,925 | $205,540 | $50,710 | $154,830 |
| 2019 | $1,915 | $205,540 | $50,710 | $154,830 |
| 2018 | $1,905 | $205,540 | $50,710 | $154,830 |
| 2017 | $1,951 | $192,890 | $44,510 | $148,380 |
| 2016 | $2,019 | $192,890 | $44,510 | $148,380 |
| 2015 | $2,019 | $192,890 | $44,510 | $148,380 |
| 2014 | $1,892 | $192,890 | $44,510 | $148,380 |
Source: Public Records
Map
Nearby Homes
- Cypress Springs Dr
- 0 Cypress Creek Dr
- 0 Shortleaf Dr Unit 10119597
- 15 Gina Lee Terrace
- 0 Pearces Rd Unit 10098328
- 150 Alston Pruitt Rd
- 45 Leisure Ln
- 55 Leisure Ln
- 70 Leisure Ln
- 116 Louisburg Country Club
- 2329 N Carolina 561
- Lot 18 Cypress Springs Dr
- 491 Nc 56 Hwy E
- 592 Perdues Rd
- 376 T K Allen Rd
- 0 Stallings Mill Rd
- 00 Stallings Mill Rd Unit LotWP007
- 00 Stallings Mill Rd Unit LotWP005
- 00 Stallings Mill Rd Unit LotWP004
- 00 Stallings Mill Rd Unit LotWP003
- 399 Wheless Rd
- 140 Chanute Cir
- 10 Faith Gardens Dr
- 15 Faith Gardens Dr
- 239/241 Vega Loop
- 216 Vega Dr
- 111 Hupaw Dr
- 105 Kiki Dr
- 110 Kiki Dr
- 110 Kiki Ln
- 113 Miami Dr
- 115 Osela Dr
- 136 Okmulgee Dr
- 106 Owaso Dr
- 109 Poteau Dr
- 161 Griffith Park Rd
- 110 Kiki Ln Unit C-1716
- 110 Kiki Dr Unit C1716
- 111 Carriage Manor Cir Unit Avail
- 113 Miami Dr Unit C1877