V
Landlord's Agent in 2024
Varunesh Sharma
Lotus Property Investments, LLC.
(770) 814-1036
1 in this area
5 Total Sales
Estimated Value: $520,000 - $590,000
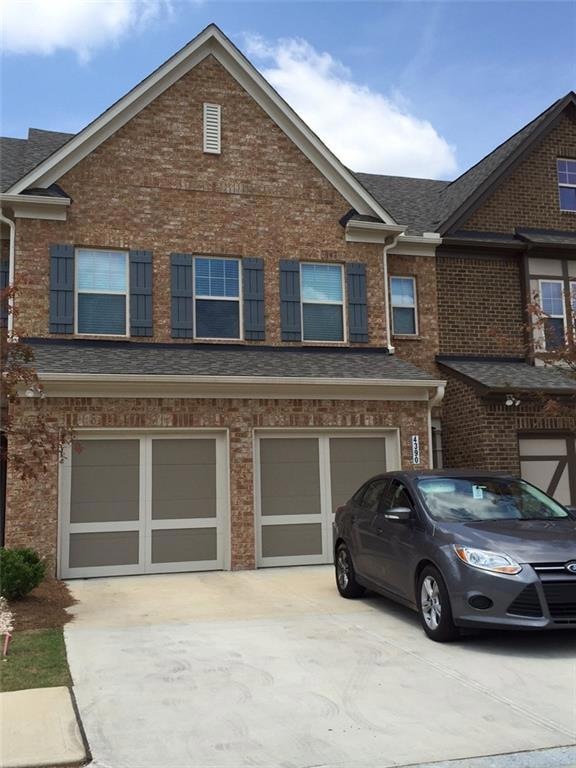
Highly sought after JOHNS CREEK location in Lambert High school district. BEAUTIFUL 3 STORY TOWNHOUSE, Don't miss this opportunity! Very well maintained and open living space on main floor. Hardwood floors throughout the main floor. Large Kitchen with plenty of cabinet space, granite countertops and stainless steel appliances. 2nd floor offers 3 spacious bedrooms, 3rd floor loft offers a large bedroom with full bath- perfect for home office or media room! Located on at the end of the community, the lot offers privacy and not a lot of neighborhood traffic.
Last Agent to Rent the Property
Lotus Property Investments, LLC. License #433063 Listed on: 07/09/2024
Last Renter's Agent
Lotus Property Investments, LLC. License #433063 Listed on: 07/09/2024
| Date | Event | Price | List to Sale | Price per Sq Ft |
|---|---|---|---|---|
| 07/29/2024 07/29/24 | Rented | $2,490 | 0.0% | -- |
| 07/19/2024 07/19/24 | Under Contract | -- | -- | -- |
| 07/13/2024 07/13/24 | Price Changed | $2,490 | -12.6% | $1 / Sq Ft |
| 07/09/2024 07/09/24 | For Rent | $2,850 | +46.2% | -- |
| 04/01/2018 04/01/18 | Rented | $1,950 | 0.0% | -- |
| 03/05/2018 03/05/18 | Under Contract | -- | -- | -- |
| 01/12/2018 01/12/18 | For Rent | $1,950 | +2.6% | -- |
| 12/12/2014 12/12/14 | Rented | -- | -- | -- |
| 11/12/2014 11/12/14 | Under Contract | -- | -- | -- |
| 10/12/2014 10/12/14 | For Rent | $1,900 | -- | -- |
| Year | Tax Paid | Tax Assessment Tax Assessment Total Assessment is a certain percentage of the fair market value that is determined by local assessors to be the total taxable value of land and additions on the property. | Land | Improvement |
|---|---|---|---|---|
| 2025 | $5,095 | $223,856 | $78,000 | $145,856 |
| 2024 | $5,095 | $207,788 | $66,000 | $141,788 |
| 2023 | $4,502 | $182,916 | $56,000 | $126,916 |
| 2022 | $3,920 | $126,336 | $40,000 | $86,336 |
| 2021 | $3,489 | $126,336 | $40,000 | $86,336 |
| 2020 | $3,800 | $137,624 | $56,000 | $81,624 |
| 2019 | $3,763 | $136,076 | $56,000 | $80,076 |
| 2018 | $3,228 | $116,724 | $32,000 | $84,724 |
| 2017 | $2,887 | $104,024 | $32,000 | $72,024 |
| 2016 | $2,887 | $104,024 | $32,000 | $72,024 |
| 2015 | $2,892 | $104,024 | $32,000 | $72,024 |
| 2014 | $847 | $32,000 | $0 | $0 |
V
Landlord's Agent in 2024
Varunesh Sharma
Lotus Property Investments, LLC.
(770) 814-1036
1 in this area
5 Total Sales

Seller's Agent in 2018
Heather Lee
HOME Luxury Real Estate
(404) 455-9506
4 in this area
28 Total Sales
Seller's Agent in 2014
Jaya Choudhary
Atlanta Communities
(404) 542-5292
13 in this area
104 Total Sales
Source: First Multiple Listing Service (FMLS)
MLS Number: 7418002
APN: 140-092
![]() Listings identified with the FMLS IDX logo come from FMLS and are held by brokerage firms other than the owner of this website. The listing brokerage is identified in any listing details. Information is deemed reliable but is not guaranteed. If you believe any FMLS listing contains material that infringes your copyrighted work please visit www.fmls.com/dmca to review our DMCA policy and learn how to submit a takedown request. © 2025 First Multiple Listing Service, Inc.
Listings identified with the FMLS IDX logo come from FMLS and are held by brokerage firms other than the owner of this website. The listing brokerage is identified in any listing details. Information is deemed reliable but is not guaranteed. If you believe any FMLS listing contains material that infringes your copyrighted work please visit www.fmls.com/dmca to review our DMCA policy and learn how to submit a takedown request. © 2025 First Multiple Listing Service, Inc.
Disclaimer: Certain information contained herein is derived from information provided by parties other than Homes.com. All information provided is deemed reliable, but is not guaranteed to be accurate and should be independently verified.