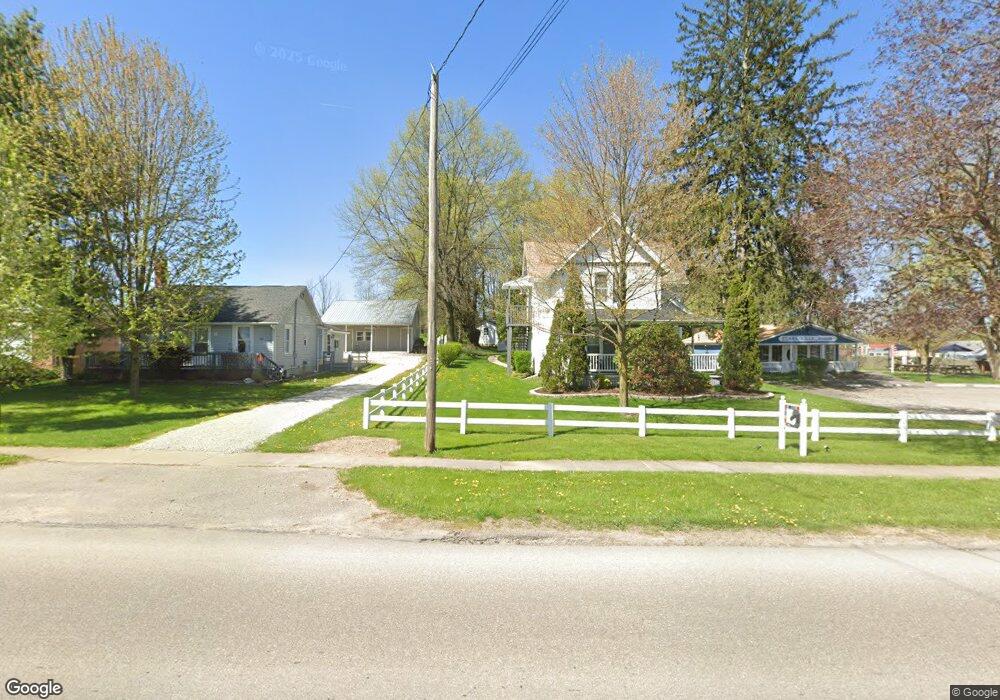
4390 Kinsman Rd Middlefield, OH 44062
Estimated Value: $197,841 - $219,000
5
Beds
2
Baths
1,816
Sq Ft
$114/Sq Ft
Est. Value
About This Home
This home is located at 4390 Kinsman Rd, Middlefield, OH 44062 and is currently estimated at $206,210, approximately $113 per square foot. 4390 Kinsman Rd is a home with nearby schools including Mesopotamia Elementary School, Bloomfield High School, and Valley View.
Ownership History
Date
Name
Owned For
Owner Type
Purchase Details
Closed on
Apr 11, 2022
Sold by
Miller Martha J
Bought by
J-Cemps Ltd
Current Estimated Value
Purchase Details
Closed on
May 11, 2020
Sold by
Miller Eli D and Miller Martha J
Bought by
J Cemps Ltd
Home Financials for this Owner
Home Financials are based on the most recent Mortgage that was taken out on this home.
Original Mortgage
$140,000
Interest Rate
3.3%
Mortgage Type
Land Contract Argmt. Of Sale
Purchase Details
Closed on
Jan 1, 1990
Bought by
Eli Eli D and Eli S
Create a Home Valuation Report for This Property
The Home Valuation Report is an in-depth analysis detailing your home's value as well as a comparison with similar homes in the area
Purchase History
| Date | Buyer | Sale Price | Title Company |
|---|---|---|---|
| J-Cemps Ltd | $150,000 | Ohly Robert S | |
| J Cemps Ltd | $15,000 | None Available | |
| Eli Eli D | -- | -- |
Source: Public Records
Mortgage History
| Date | Status | Borrower | Loan Amount |
|---|---|---|---|
| Previous Owner | J Cemps Ltd | $140,000 |
Source: Public Records
Tax History
| Year | Tax Paid | Tax Assessment Tax Assessment Total Assessment is a certain percentage of the fair market value that is determined by local assessors to be the total taxable value of land and additions on the property. | Land | Improvement |
|---|---|---|---|---|
| 2024 | $4,069 | $78,270 | $5,430 | $72,840 |
| 2023 | $4,060 | $63,950 | $5,430 | $58,520 |
| 2022 | $1,334 | $41,550 | $5,010 | $36,540 |
| 2021 | $1,336 | $41,550 | $5,010 | $36,540 |
| 2020 | $1,338 | $41,550 | $5,010 | $36,540 |
| 2019 | $1,138 | $35,070 | $4,620 | $30,450 |
| 2018 | $1,111 | $35,070 | $4,620 | $30,450 |
| 2017 | $1,110 | $35,070 | $4,620 | $30,450 |
| 2016 | $1,272 | $38,920 | $3,990 | $34,930 |
| 2015 | $1,275 | $38,920 | $3,990 | $34,930 |
| 2014 | $1,274 | $38,920 | $3,990 | $34,930 |
| 2013 | $1,292 | $38,920 | $3,990 | $34,930 |
Source: Public Records
Map
Nearby Homes
- 8070 Parkman Mesopotamia Rd
- 16510 Bundysburg Rd
- 9561 Creaser Rd
- 229 2nd St
- 9575 State Route 45
- 2271 Peck Leach Rd
- 15791 Madison Rd
- 16298 Weathervane Dr
- 14706 Steeplechase Dr
- 7182 Ohio 45
- 0 Warren Painsville Rd Unit 5188382
- 16352 Nauvoo Rd
- 16352 and 16350 Nauvoo Rd
- 16350 Nauvoo Rd
- 17808 Nash Rd
- 1581 E Flagg Rd
- 7561 Rockwood Rd
- 16310 Madison Rd
- 16008 Button St
- V/L Noble Rd
- 4398 Kinsman Rd
- 8148 Houghton Phelps Creek Rd
- 4387 Kinsman Rd
- 4387 Kinsman Rd
- 4406 Kinsman
- 8735 State Route 534
- 4414 Kinsman
- 4383 Kinsman Rd
- 4401 Kinsman Rd
- V/L Ohio 534
- 4393 Kinsman Rd
- 0 Kinsman Mespo Rd
- 8753 State Route 534
- 0 Ohio 87
- 8759 State Route 534
- 8759 Ohio 534
- 4378 Creamery Rd
- 8683 State Route 534
- 4432 Kinsman Rd
- 8724 State Route 534
Your Personal Tour Guide
Ask me questions while you tour the home.