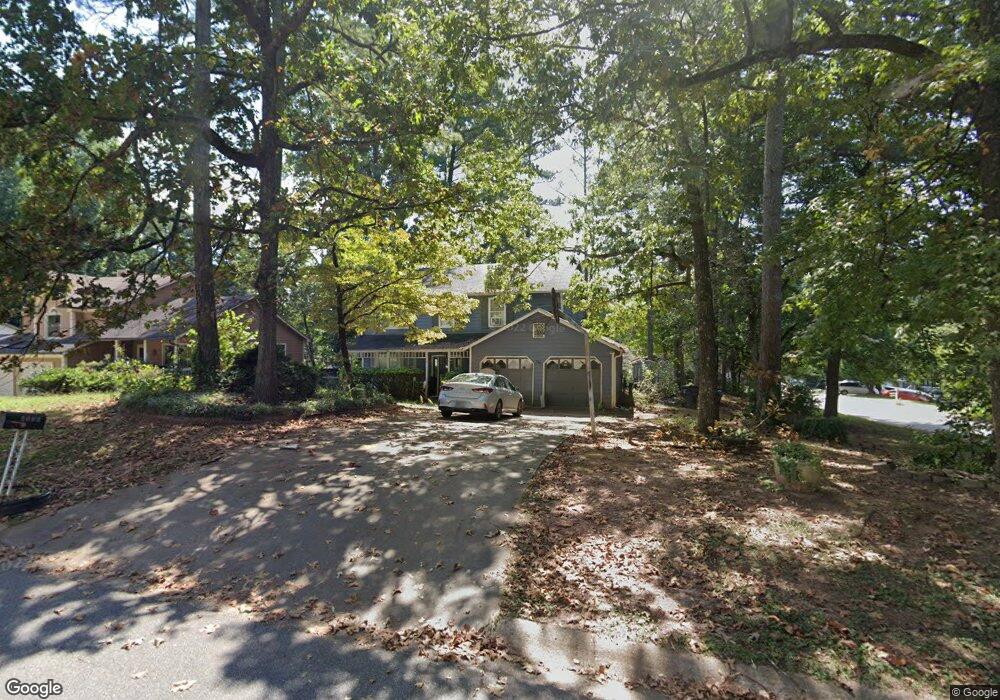
4390 Windward Ln Unit 4 Norcross, GA 30093
Estimated Value: $321,000 - $388,000
3
Beds
3
Baths
1,805
Sq Ft
$194/Sq Ft
Est. Value
About This Home
This home is located at 4390 Windward Ln Unit 4, Norcross, GA 30093 and is currently estimated at $350,437, approximately $194 per square foot. 4390 Windward Ln Unit 4 is a home located in Gwinnett County with nearby schools including Ferguson Elementary School, Louise Radloff Middle School, and Meadowcreek High School.
Ownership History
Date
Name
Owned For
Owner Type
Purchase Details
Closed on
Apr 24, 2020
Sold by
Shipman James E
Bought by
Shipman Cherie
Current Estimated Value
Home Financials for this Owner
Home Financials are based on the most recent Mortgage that was taken out on this home.
Original Mortgage
$109,706
Outstanding Balance
$97,369
Interest Rate
3.5%
Mortgage Type
FHA
Estimated Equity
$253,068
Purchase Details
Closed on
May 21, 2013
Sold by
Shipman James
Bought by
Shipman James E
Home Financials for this Owner
Home Financials are based on the most recent Mortgage that was taken out on this home.
Original Mortgage
$74,832
Interest Rate
4.4%
Mortgage Type
FHA
Purchase Details
Closed on
Oct 6, 1997
Sold by
Assari Fatemeh
Bought by
Shipman James E and Shipman Corstella
Home Financials for this Owner
Home Financials are based on the most recent Mortgage that was taken out on this home.
Original Mortgage
$106,050
Interest Rate
7.6%
Mortgage Type
FHA
Create a Home Valuation Report for This Property
The Home Valuation Report is an in-depth analysis detailing your home's value as well as a comparison with similar homes in the area
Home Values in the Area
Average Home Value in this Area
Purchase History
| Date | Buyer | Sale Price | Title Company |
|---|---|---|---|
| Shipman Cherie | $175,000 | -- | |
| Shipman James E | -- | -- | |
| Shipman James E | $108,000 | -- |
Source: Public Records
Mortgage History
| Date | Status | Borrower | Loan Amount |
|---|---|---|---|
| Open | Shipman Cherie | $109,706 | |
| Previous Owner | Shipman James E | $74,832 | |
| Previous Owner | Shipman James E | $106,050 |
Source: Public Records
Tax History Compared to Growth
Tax History
| Year | Tax Paid | Tax Assessment Tax Assessment Total Assessment is a certain percentage of the fair market value that is determined by local assessors to be the total taxable value of land and additions on the property. | Land | Improvement |
|---|---|---|---|---|
| 2024 | $4,070 | $134,360 | $21,120 | $113,240 |
| 2023 | $4,070 | $100,360 | $22,400 | $77,960 |
| 2022 | $3,329 | $100,360 | $22,400 | $77,960 |
| 2021 | $2,937 | $79,600 | $13,600 | $66,000 |
| 2020 | $3,178 | $79,600 | $13,600 | $66,000 |
| 2019 | $693 | $69,520 | $13,600 | $55,920 |
| 2018 | $675 | $60,440 | $13,600 | $46,840 |
| 2016 | $716 | $55,920 | $10,400 | $45,520 |
| 2015 | $731 | $46,560 | $7,200 | $39,360 |
| 2014 | $725 | $43,400 | $7,200 | $36,200 |
Source: Public Records
Map
Nearby Homes
- 4139 Magnolia Glen Walk
- 4453 Freeman Ct Unit 1
- 1432 Shenta Oak Dr
- 4092 Anvil Ct Unit 2
- 1331 Sweet Pine Dr
- 4619 Rippling Brook Ct
- 4446 Arcadia Dr
- 1110 Falling Water Ln
- 1052 Rabun Dr NW Unit 2
- 1014 Brockdell Ct
- 4059 Heritage Valley Ct
- 3955 Peninsula Ct
- 3975 Creek Water Ct Unit 1
- 4017 Heritage Valley Ct
- 1151 Overland Hill Trace
- 4608 Rosemear Ct Unit 9
- 1033 Park Forest Ct NW
- 4118 Stillwater Dr Unit 4118
- 4384 Windward Ln Unit 3
- 1361 Inman Ct
- 4408 Windward Ln
- 4378 Windward Ln Unit 3
- 1351 Inman Ct
- 4391 Windward Ln
- 4397 Windward Ln
- 1402 Inman Ct
- 4385 Windward Ln Unit 3
- 4372 Windward Ln
- 4403 Windward Ln
- 0 Windward Ln Unit 8716385
- 0 Windward Ln Unit 8711065
- 0 Windward Ln Unit 8391388
- 0 Windward Ln Unit 9031879
- 0 Windward Ln Unit 9053969
- 0 Windward Ln Unit 9064746
- 0 Windward Ln Unit 8778983
- 0 Windward Ln Unit 3150608
- 0 Windward Ln Unit 3225851