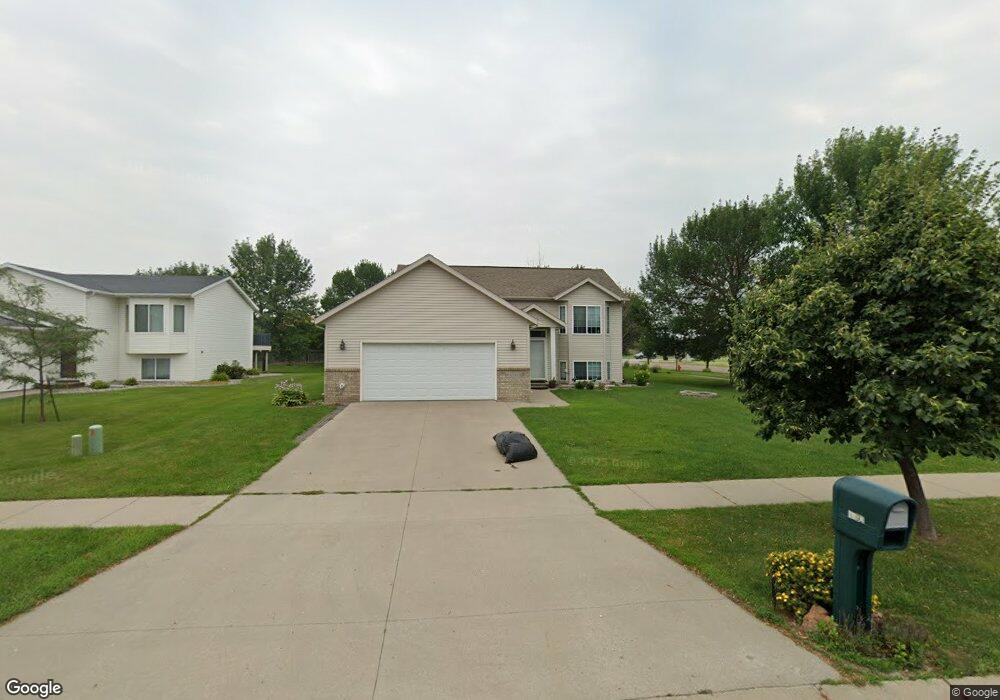
4390 Woodhaven St S Fargo, ND 58104
Woodhaven NeighborhoodEstimated Value: $336,000 - $358,000
4
Beds
2
Baths
2,112
Sq Ft
$165/Sq Ft
Est. Value
About This Home
This home is located at 4390 Woodhaven St S, Fargo, ND 58104 and is currently estimated at $349,103, approximately $165 per square foot. 4390 Woodhaven St S is a home located in Cass County with nearby schools including Kennedy Elementary School, Discovery Middle School, and Fargo Davies High School.
Ownership History
Date
Name
Owned For
Owner Type
Purchase Details
Closed on
Apr 8, 2021
Sold by
Dilbeck Kyle Lee
Bought by
Dilbeck Kyle Lee and Martin Shari
Current Estimated Value
Purchase Details
Closed on
Oct 11, 2018
Sold by
Kading Joshua D and Kading Jenny A
Bought by
Dilbeck Kyle
Home Financials for this Owner
Home Financials are based on the most recent Mortgage that was taken out on this home.
Original Mortgage
$249,856
Outstanding Balance
$217,889
Interest Rate
4.5%
Mortgage Type
VA
Estimated Equity
$131,214
Purchase Details
Closed on
Apr 15, 2011
Sold by
Atkins Corey O and Atkins Alicia
Bought by
Kading Joshua D and Kading Jenny A
Home Financials for this Owner
Home Financials are based on the most recent Mortgage that was taken out on this home.
Original Mortgage
$188,059
Interest Rate
4.5%
Mortgage Type
FHA
Purchase Details
Closed on
Feb 28, 2007
Sold by
Lle Michael V and Lle Carmen L
Bought by
Atkins Corey and Claesson Alicia
Home Financials for this Owner
Home Financials are based on the most recent Mortgage that was taken out on this home.
Original Mortgage
$126,400
Interest Rate
7.12%
Mortgage Type
Adjustable Rate Mortgage/ARM
Create a Home Valuation Report for This Property
The Home Valuation Report is an in-depth analysis detailing your home's value as well as a comparison with similar homes in the area
Home Values in the Area
Average Home Value in this Area
Purchase History
| Date | Buyer | Sale Price | Title Company |
|---|---|---|---|
| Dilbeck Kyle Lee | -- | None Available | |
| Dilbeck Kyle | $244,000 | Trn Abstract & Title | |
| Kading Joshua D | -- | -- | |
| Atkins Corey | -- | -- |
Source: Public Records
Mortgage History
| Date | Status | Borrower | Loan Amount |
|---|---|---|---|
| Open | Dilbeck Kyle | $249,856 | |
| Previous Owner | Kading Joshua D | $188,059 | |
| Previous Owner | Atkins Corey | $126,400 |
Source: Public Records
Tax History Compared to Growth
Tax History
| Year | Tax Paid | Tax Assessment Tax Assessment Total Assessment is a certain percentage of the fair market value that is determined by local assessors to be the total taxable value of land and additions on the property. | Land | Improvement |
|---|---|---|---|---|
| 2024 | $3,722 | $156,350 | $36,350 | $120,000 |
| 2023 | $4,286 | $160,300 | $35,750 | $124,550 |
| 2022 | $3,797 | $139,400 | $35,750 | $103,650 |
| 2021 | $3,331 | $123,900 | $35,750 | $88,150 |
| 2020 | $3,312 | $123,900 | $35,750 | $88,150 |
| 2019 | $3,315 | $123,900 | $22,350 | $101,550 |
| 2018 | $3,268 | $123,900 | $22,350 | $101,550 |
| 2017 | $3,055 | $116,950 | $22,350 | $94,600 |
| 2016 | $2,555 | $106,300 | $22,350 | $83,950 |
| 2015 | $2,712 | $106,300 | $15,200 | $91,100 |
| 2014 | $2,538 | $96,900 | $15,200 | $81,700 |
| 2013 | $2,377 | $90,550 | $15,200 | $75,350 |
Source: Public Records
Map
Nearby Homes
- 4374 Woodhaven St S
- 4356 Woodhaven St S
- 4375 Woodhaven St S
- 4336 Woodhaven St S
- 4318 Woodhaven St S
- 4233 44th Ave S
- 4233 44th Ave S
- 4220 43rd Ave S
- 4220 43rd Ave S
- 4226 43rd Ave S
- 4300 Woodhaven St S
- 4226 43rd Ave S
- 4235 44th Ave S
- 4235 44th Ave S
- 4286 Woodhaven St S
- 4232 43rd Ave S
- 4232 43 St SW
- 4232 43rd Ave S
- 4247 44th Ave S
- 4264 Woodhaven St S