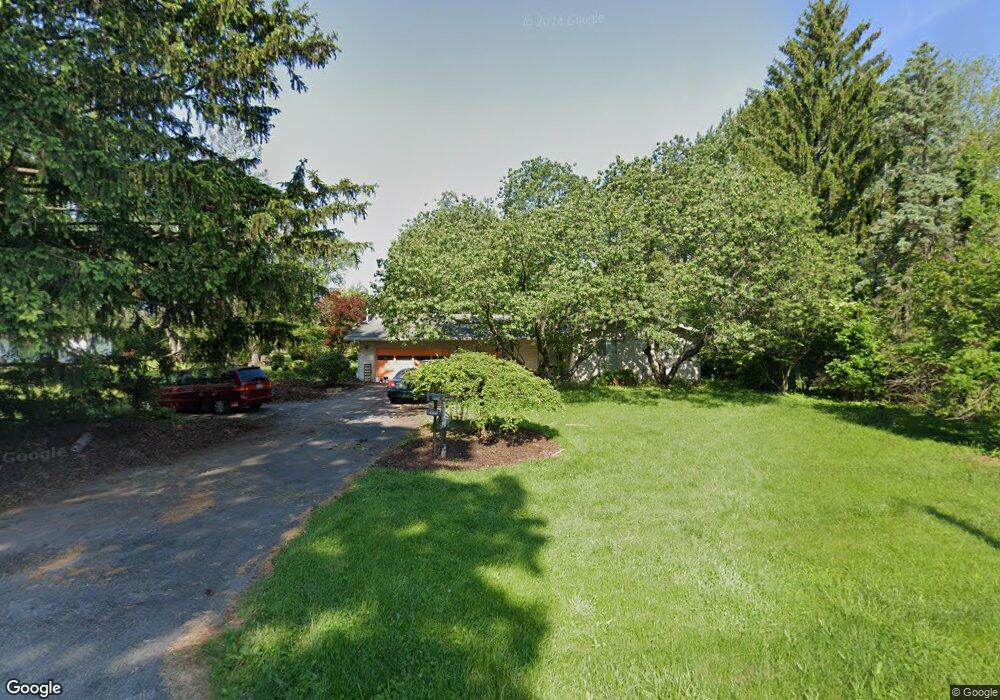
4391 Baker Rd Dayton, OH 45424
Estimated Value: $224,000 - $267,000
3
Beds
2
Baths
1,320
Sq Ft
$182/Sq Ft
Est. Value
About This Home
This home is located at 4391 Baker Rd, Dayton, OH 45424 and is currently estimated at $240,058, approximately $181 per square foot. 4391 Baker Rd is a home located in Greene County with nearby schools including Fairborn Primary School, Fairborn Intermediate School, and Fairborn Middle School.
Ownership History
Date
Name
Owned For
Owner Type
Purchase Details
Closed on
Oct 7, 2022
Sold by
Ward Randal L
Bought by
Kempton Jeffrey Michael and Kempton Shannon Lee
Current Estimated Value
Home Financials for this Owner
Home Financials are based on the most recent Mortgage that was taken out on this home.
Original Mortgage
$180,500
Outstanding Balance
$173,511
Interest Rate
5.89%
Mortgage Type
New Conventional
Estimated Equity
$66,547
Purchase Details
Closed on
Sep 28, 2020
Sold by
Ward Bruce A
Bought by
Ward Randal L
Purchase Details
Closed on
Aug 18, 2019
Sold by
Estate Of Lester Ward
Bought by
Ward Bruce A and Ward Randal L
Purchase Details
Closed on
Dec 23, 1999
Sold by
Petkewitz Thomas G and Petkewitz Joseph T
Bought by
Ward Lester and Ward Roberta
Home Financials for this Owner
Home Financials are based on the most recent Mortgage that was taken out on this home.
Original Mortgage
$74,400
Interest Rate
7.81%
Create a Home Valuation Report for This Property
The Home Valuation Report is an in-depth analysis detailing your home's value as well as a comparison with similar homes in the area
Home Values in the Area
Average Home Value in this Area
Purchase History
| Date | Buyer | Sale Price | Title Company |
|---|---|---|---|
| Kempton Jeffrey Michael | $190,000 | None Listed On Document | |
| Ward Randal L | $50,000 | None Available | |
| Ward Bruce A | -- | None Available | |
| Ward Lester | $131,000 | -- |
Source: Public Records
Mortgage History
| Date | Status | Borrower | Loan Amount |
|---|---|---|---|
| Open | Kempton Jeffrey Michael | $180,500 | |
| Previous Owner | Ward Lester | $74,400 |
Source: Public Records
Tax History
| Year | Tax Paid | Tax Assessment Tax Assessment Total Assessment is a certain percentage of the fair market value that is determined by local assessors to be the total taxable value of land and additions on the property. | Land | Improvement |
|---|---|---|---|---|
| 2024 | $3,372 | $69,090 | $14,040 | $55,050 |
| 2023 | $3,347 | $69,090 | $14,040 | $55,050 |
| 2022 | $2,876 | $49,880 | $12,210 | $37,670 |
| 2021 | $2,917 | $49,880 | $12,210 | $37,670 |
| 2020 | $2,930 | $49,880 | $12,210 | $37,670 |
| 2019 | $2,190 | $37,340 | $11,190 | $26,150 |
| 2018 | $2,212 | $37,340 | $11,190 | $26,150 |
| 2017 | $1,616 | $37,340 | $11,190 | $26,150 |
| 2016 | $1,616 | $36,760 | $10,510 | $26,250 |
| 2015 | $739 | $36,760 | $10,510 | $26,250 |
| 2014 | $1,427 | $36,760 | $10,510 | $26,250 |
Source: Public Records
Map
Nearby Homes
- 4521 Willow Mist Dr
- 6907 Pegram Way
- 6941 Greeley Ave
- 5746 Chukar Dr
- 0 Gander Rd Unit 949715
- 6669 Lexington Place N
- 5631 Chukar Dr
- 4533 Ohio 4
- 6920 Buell Ln
- 6241 Pheasant Hill Rd
- 5423 Zachary Ln
- 5419 Zachary Ln
- 5415 Zachary Ln
- 5411 Zachary Ln
- 5408 Zachary Ln
- 5540 Signet Dr
- 4048 Quail Bush Dr
- 4800 Silver Oak St
- 4410 Hardwood Trail
- 0 Forest Ridge Blvd Unit 937866
Your Personal Tour Guide
Ask me questions while you tour the home.