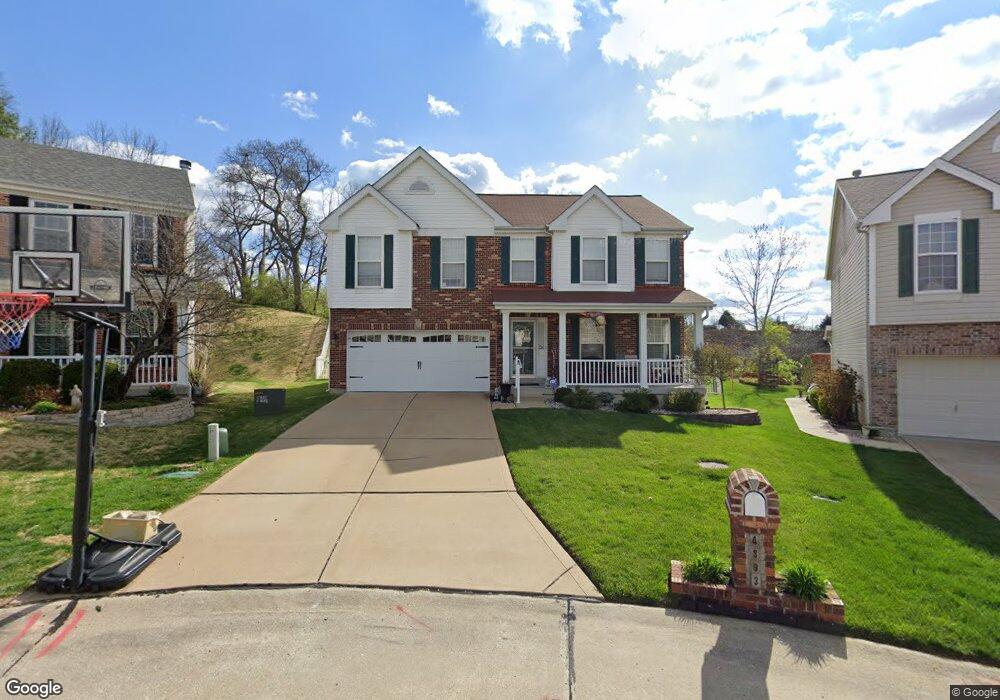
4393 Hawkins Glen Way Saint Louis, MO 63129
Estimated Value: $411,000 - $492,000
3
Beds
5
Baths
2,564
Sq Ft
$178/Sq Ft
Est. Value
About This Home
This home is located at 4393 Hawkins Glen Way, Saint Louis, MO 63129 and is currently estimated at $455,409, approximately $177 per square foot. 4393 Hawkins Glen Way is a home located in St. Louis County with nearby schools including Hagemann Elementary School, Washington Middle School, and Mehlville High School.
Ownership History
Date
Name
Owned For
Owner Type
Purchase Details
Closed on
Sep 28, 2020
Sold by
Patrico Tony Joseph and Patrico Lisa Sue
Bought by
Tony J Patrico Revocable Living Trust and Lisa S Patrico Revocable Living Trust
Current Estimated Value
Purchase Details
Closed on
Oct 25, 2012
Sold by
Patrico Tony J and Patrico Lisa S
Bought by
Patrico Tony J
Home Financials for this Owner
Home Financials are based on the most recent Mortgage that was taken out on this home.
Original Mortgage
$262,260
Interest Rate
3.25%
Mortgage Type
FHA
Purchase Details
Closed on
Apr 23, 2010
Sold by
Patrico Tony J and Patrico Lisa S
Bought by
Patrico Tony J and Patrico Lisa S
Purchase Details
Closed on
Sep 19, 2002
Sold by
Patrico Tony J and Patrico Lisa Sue
Bought by
Patrico Tony J and Patrico Lisa Sue
Create a Home Valuation Report for This Property
The Home Valuation Report is an in-depth analysis detailing your home's value as well as a comparison with similar homes in the area
Home Values in the Area
Average Home Value in this Area
Purchase History
| Date | Buyer | Sale Price | Title Company |
|---|---|---|---|
| Tony J Patrico Revocable Living Trust | -- | New Title Company Name | |
| Tony J Patrico Revocable Living Trust | -- | New Title Company Name | |
| Patrico Tony J | -- | None Available | |
| Patrico Tony J | -- | Tri | |
| Patrico Tony J | -- | None Available | |
| Patrico Tony J | -- | Capital Title |
Source: Public Records
Mortgage History
| Date | Status | Borrower | Loan Amount |
|---|---|---|---|
| Previous Owner | Patrico Tony J | $262,260 |
Source: Public Records
Tax History Compared to Growth
Tax History
| Year | Tax Paid | Tax Assessment Tax Assessment Total Assessment is a certain percentage of the fair market value that is determined by local assessors to be the total taxable value of land and additions on the property. | Land | Improvement |
|---|---|---|---|---|
| 2025 | $4,839 | $76,340 | $16,740 | $59,600 |
| 2024 | $4,839 | $72,160 | $12,560 | $59,600 |
| 2023 | $4,839 | $72,160 | $12,560 | $59,600 |
| 2022 | $4,045 | $61,370 | $10,890 | $50,480 |
| 2021 | $3,915 | $61,370 | $10,890 | $50,480 |
| 2020 | $3,912 | $58,330 | $9,200 | $49,130 |
| 2019 | $3,900 | $58,330 | $9,200 | $49,130 |
| 2018 | $3,808 | $51,420 | $8,380 | $43,040 |
| 2017 | $3,803 | $51,420 | $8,380 | $43,040 |
| 2016 | $3,639 | $47,200 | $8,380 | $38,820 |
| 2015 | $3,341 | $47,200 | $8,380 | $38,820 |
| 2014 | -- | $44,570 | $14,590 | $29,980 |
Source: Public Records
Map
Nearby Homes
- 5942 Hawkins Fuchs Rd
- 4357 Bristol View Ct
- 5600 Wickershire Ln
- 4374 Bristol View Ct
- 4423 Saddleridge Farm Dr
- 5968 Southcrest Way
- 4330 Canyonside Ln
- 5524 Providence Place Dr
- 5703 Lilac Trails Dr
- 6055 Bayou Bend Ct
- 4523 Beaver Brook Ct
- 5417 Morningdale Place
- 5714 Shining Day Place
- 5896 Rockland Ln
- 5827 Bridleford Ln
- 4305 Grand Marnier Dr
- 4251 Green Grove Ct
- 5824 Bridleford Ln
- 5251 Tuscan Chase Ct
- 3715 Pinon Pine Ct
- 4389 Hawkins Glen Way
- 4397 Hawkins Glen Way
- 2 Aspen II at Bend S
- 2BBLT Aspen II at Bend S
- 4385 Hawkins Glen Way
- 4396 Hawkins Glen Way
- 4381 Hawkins Glen Way
- 4374 Southview Way Dr
- 4370 Southview Way Dr
- 4362 Southview Way Dr
- 4366 Southview Way Dr
- 4388 Hawkins Glen Way
- 4392 Hawkins Glen Way
- 4377 Hawkins Glen Way
- 4384 Hawkins Glen Way
- 2 Sequoia at Bend S
- 4358 Southview Way Dr
- 4380 Hawkins Glen Way
- 4378 Southview Way Dr
- 4373 Hawkins Glen Way