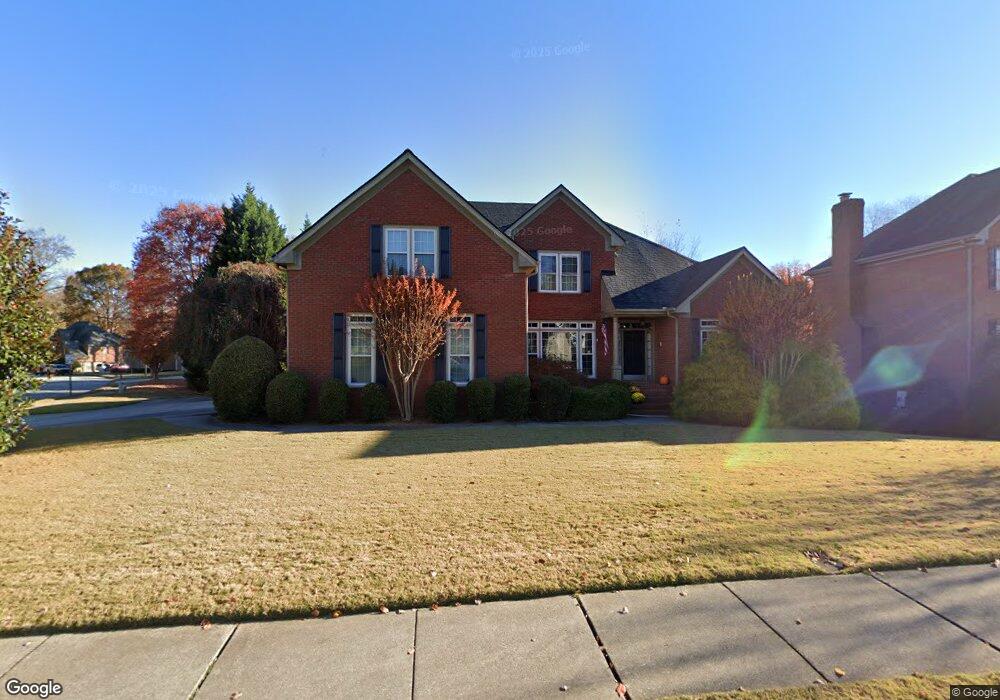
4393 Whittington Way Norcross, GA 30092
Estimated Value: $1,114,000 - $1,484,000
3
Beds
3
Baths
4,602
Sq Ft
$270/Sq Ft
Est. Value
About This Home
This home is located at 4393 Whittington Way, Norcross, GA 30092 and is currently estimated at $1,240,251, approximately $269 per square foot. 4393 Whittington Way is a home located in Gwinnett County with nearby schools including Simpson Elementary School, Pinckneyville Middle School, and Norcross High School.
Ownership History
Date
Name
Owned For
Owner Type
Purchase Details
Closed on
Apr 15, 2022
Sold by
Clapp David
Bought by
Baumgarten Jeffrey Mark and Baumgarten Phuong Khanh
Current Estimated Value
Purchase Details
Closed on
Nov 17, 2014
Sold by
Yun Hokun
Bought by
Clapp David and Clapp Beth
Purchase Details
Closed on
Aug 30, 2013
Sold by
Christensen Edward J
Bought by
Yun Hokun
Home Financials for this Owner
Home Financials are based on the most recent Mortgage that was taken out on this home.
Original Mortgage
$400,000
Interest Rate
4.37%
Mortgage Type
New Conventional
Create a Home Valuation Report for This Property
The Home Valuation Report is an in-depth analysis detailing your home's value as well as a comparison with similar homes in the area
Home Values in the Area
Average Home Value in this Area
Purchase History
| Date | Buyer | Sale Price | Title Company |
|---|---|---|---|
| Baumgarten Jeffrey Mark | $1,000,000 | -- | |
| Clapp David | $602,000 | -- | |
| Yun Hokun | $590,000 | -- |
Source: Public Records
Mortgage History
| Date | Status | Borrower | Loan Amount |
|---|---|---|---|
| Previous Owner | Yun Hokun | $400,000 |
Source: Public Records
Tax History Compared to Growth
Tax History
| Year | Tax Paid | Tax Assessment Tax Assessment Total Assessment is a certain percentage of the fair market value that is determined by local assessors to be the total taxable value of land and additions on the property. | Land | Improvement |
|---|---|---|---|---|
| 2024 | $13,767 | $400,000 | $69,200 | $330,800 |
| 2023 | $13,767 | $400,000 | $69,200 | $330,800 |
| 2022 | $0 | $373,640 | $63,200 | $310,440 |
| 2021 | $9,579 | $285,600 | $44,000 | $241,600 |
| 2020 | $9,644 | $285,600 | $44,000 | $241,600 |
| 2019 | $9,331 | $285,600 | $44,000 | $241,600 |
| 2018 | $8,763 | $257,760 | $40,000 | $217,760 |
| 2016 | $8,137 | $231,120 | $40,000 | $191,120 |
| 2015 | $8,237 | $231,120 | $40,000 | $191,120 |
| 2014 | -- | $231,120 | $40,000 | $191,120 |
Source: Public Records
Map
Nearby Homes
- 4948 Sudbrook Way
- 4916 Sudbrook Way Unit 253
- The Adams Plan at Waterside - Condos
- 4457 Watervale Way Unit 292
- 4477 Watervale Way Unit 286
- 5047 Shirley Oaks Dr Unit 313
- 4903 Sudbrook Way Unit 239
- The Stanley Plan at Waterside - Single Family
- The Stafford Plan at Waterside - Single Family
- 5039 Shirley Oaks Dr Unit 315
- 4479 Watervale Way Unit 285
- 5059 Shirley Oaks Dr Unit 309
- The Barrett II Plan at Waterside - Condos
- The Benton II Plan at Waterside - Townhomes
- 5134 Bandolino Ln Unit 320
- The Cascade Plan at Waterside - Condos
- The Grayson II Plan at Waterside - Single Family
- 5124 Bandolino Ln Unit 323
- The Grayson II Plan at Waterside - Townhomes
- 4923 Sudbrook Way Unit 233
- 5066 Staverly Ln
- 4383 Whittington Way
- 5056 Staverly Ln
- 4373 Whittington Way
- 5086 Staverly Ln Unit 6
- 0 Staverly Ln Unit 7468533
- 0 Staverly Ln Unit 7298759
- 0 Staverly Ln Unit 8753542
- 0 Staverly Ln Unit 8248159
- 0 Staverly Ln Unit 8224975
- 0 Staverly Ln Unit 8182804
- 0 Staverly Ln Unit 8021113
- 0 Staverly Ln Unit 7605473
- 0 Staverly Ln Unit 8141148
- 5071 Staverly Ln
- 4370 Missendell Ln Unit 3
- 5051 Staverly Ln
- 4363 Whittington Way
- 5046 Staverly Ln Unit V
- 4360 Missendell Ln