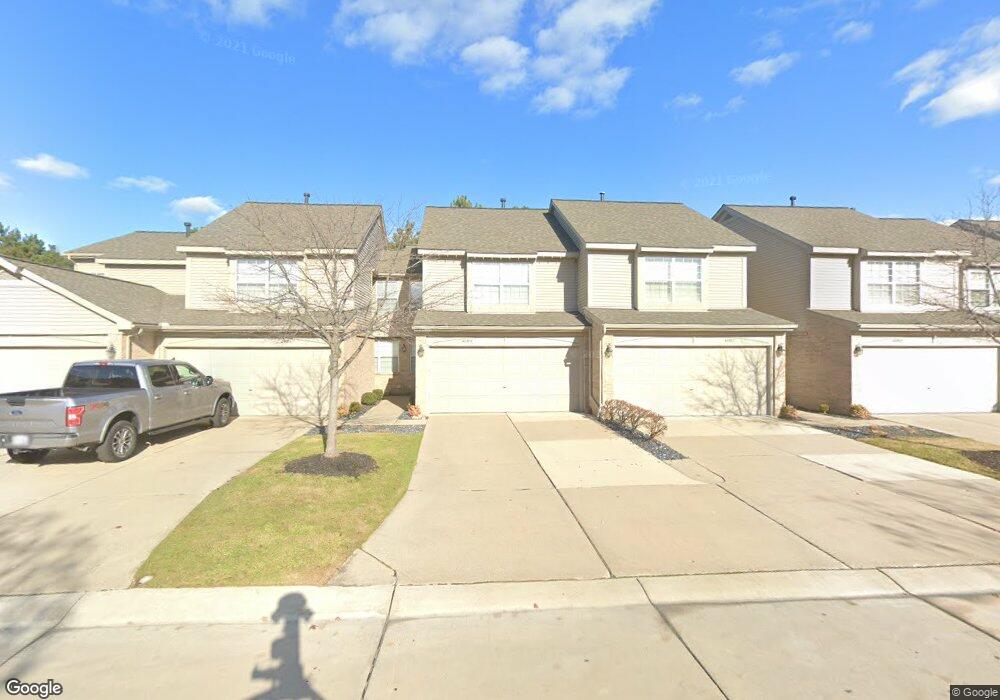
43983 Stoney Ln Unit 92 Sterling Heights, MI 48313
Estimated Value: $234,000 - $265,000
2
Beds
3
Baths
1,339
Sq Ft
$190/Sq Ft
Est. Value
About This Home
This home is located at 43983 Stoney Ln Unit 92, Sterling Heights, MI 48313 and is currently estimated at $254,187, approximately $189 per square foot. 43983 Stoney Ln Unit 92 is a home located in Macomb County with nearby schools including Graebner Elementary School, Bemis Junior High School, and Henry Ford II High School.
Ownership History
Date
Name
Owned For
Owner Type
Purchase Details
Closed on
Nov 21, 2023
Sold by
Smith Troy R
Bought by
Sachdev Bakhshish and Sachdev Surjeet K
Current Estimated Value
Home Financials for this Owner
Home Financials are based on the most recent Mortgage that was taken out on this home.
Original Mortgage
$179,250
Interest Rate
6.66%
Mortgage Type
New Conventional
Purchase Details
Closed on
Sep 9, 2016
Sold by
The Cathy Ann Kukula Trust and Kukula Cathy Ann
Bought by
Smith Troy R
Home Financials for this Owner
Home Financials are based on the most recent Mortgage that was taken out on this home.
Original Mortgage
$149,785
Interest Rate
3.43%
Mortgage Type
VA
Purchase Details
Closed on
Aug 20, 2013
Sold by
Kukula Cathy A
Bought by
Kukula Cathy Ann and Cathy Ann Kukula Trust
Create a Home Valuation Report for This Property
The Home Valuation Report is an in-depth analysis detailing your home's value as well as a comparison with similar homes in the area
Home Values in the Area
Average Home Value in this Area
Purchase History
| Date | Buyer | Sale Price | Title Company |
|---|---|---|---|
| Sachdev Bakhshish | $240,000 | Stewart Title Guaranty Company | |
| Sachdev Bakhshish | $240,000 | Stewart Title Guaranty Company | |
| Smith Troy R | $145,000 | Title One Inc | |
| Kukula Cathy Ann | -- | None Available |
Source: Public Records
Mortgage History
| Date | Status | Borrower | Loan Amount |
|---|---|---|---|
| Previous Owner | Sachdev Bakhshish | $179,250 | |
| Previous Owner | Smith Troy R | $149,785 |
Source: Public Records
Tax History Compared to Growth
Tax History
| Year | Tax Paid | Tax Assessment Tax Assessment Total Assessment is a certain percentage of the fair market value that is determined by local assessors to be the total taxable value of land and additions on the property. | Land | Improvement |
|---|---|---|---|---|
| 2025 | $3,315 | $109,100 | $0 | $0 |
| 2024 | $3,031 | $95,500 | $0 | $0 |
| 2023 | $2,862 | $90,900 | $0 | $0 |
| 2022 | $2,983 | $84,100 | $0 | $0 |
| 2021 | $2,922 | $78,600 | $0 | $0 |
| 2020 | $2,606 | $74,700 | $0 | $0 |
| 2019 | $2,695 | $74,000 | $0 | $0 |
| 2018 | $2,701 | $70,100 | $0 | $0 |
| 2017 | $2,579 | $63,800 | $10,000 | $53,800 |
| 2016 | $1,537 | $63,800 | $0 | $0 |
| 2015 | -- | $59,300 | $0 | $0 |
| 2014 | -- | $41,400 | $0 | $0 |
Source: Public Records
Map
Nearby Homes
- 43853 Stoney Ln Unit 63
- 15090 Northpointe Dr
- 14651 Lakeshore Dr
- 15297 Yale Dr Unit 232
- 15357 Yale Dr Unit 211
- 15371 Cornell Dr Unit 92
- 15432 Yale Dr Unit 179
- 44272 Princeton Dr Unit 159
- 43300 Hayes Rd
- 15472 Claremont Dr N Unit 165
- 43267 Woodbridge Dr Unit 102
- 43014 Strand Dr Unit 43
- 15854 Charleston Dr Unit 232
- 14579 Vauxhall Dr Unit 84
- 43433 Claremont Dr E
- 43203 Strand Dr Unit 23
- 43146 Dante Ct
- 16539 Covington Dr
- 43038 Strand Dr Unit 46
- 14700 19 Mile Rd
- 43991 Stoney Ln Unit 1 94
- 43999 Stoney Ln Unit 96
- 43991 Stoney Ln Unit 94
- 43987 Stoney Ln Unit 93
- 43983 Stoney Ln
- 43979 Stoney Ln Unit 91
- 43975 Stoney Ln Unit 90
- 43995 Stoney Ln
- 43970 Stoney Lane#8
- 43986 Stoney Ln Unit 4
- 43970 Stoney Ln Unit 8
- 43978 Stoney Ln Unit 6
- 43982 Stoney Ln
- 43994 Stoney Ln
- 43998 Stoney Ln
- 43990 Stoney Ln Unit 3
- 43990 Stoney Ln
- 43990 Stoney Ln Unit 7, 3
- 43963 Stoney Ln Unit 88
- 43959 Stoney Ln