Estimated Value: $604,355 - $671,000
3
Beds
3
Baths
3,094
Sq Ft
$202/Sq Ft
Est. Value
About This Home
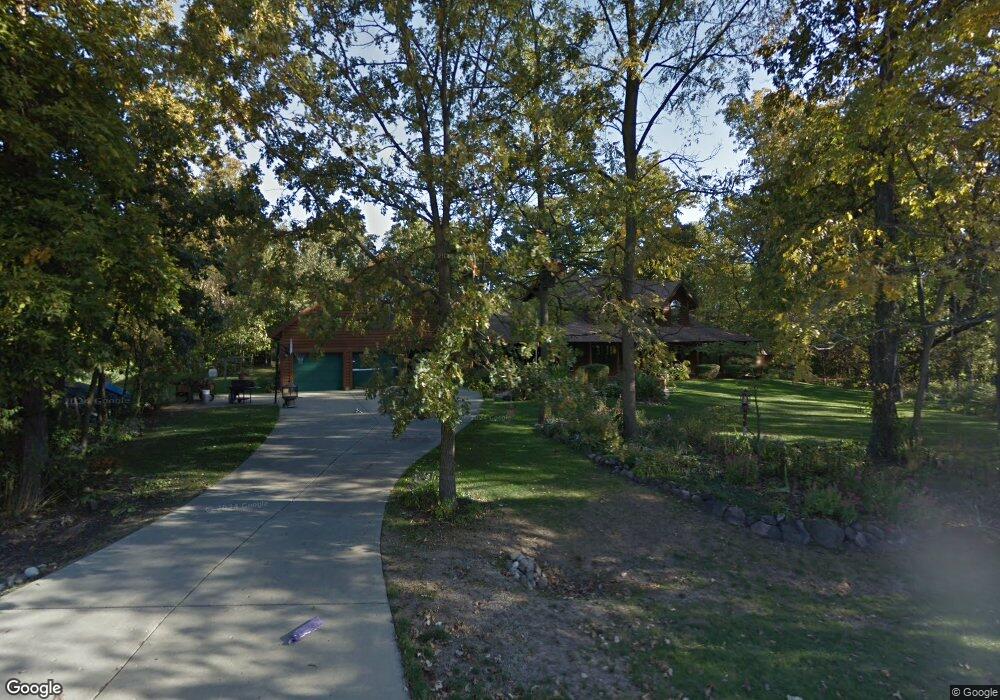
This home is located at 43W072 Carletta Ln, Elgin, IL 60124 and is currently estimated at $624,589, approximately $201 per square foot. 43W072 Carletta Ln is a home located in Kane County with nearby schools including Lily Lake Grade School, Central Middle School, and Prairie Knolls Middle School.
Ownership History
Date
Name
Owned For
Owner Type
Purchase Details
Closed on
Aug 9, 2000
Sold by
Brindley Gerry L and Brindley Lesley G
Bought by
Fischer Brian E and Fischer Nona L
Current Estimated Value
Purchase Details
Closed on
Jul 24, 1998
Sold by
Lange Laurie and Lange Richard
Bought by
Brindley Gerry L and Brindley Lesley G
Home Financials for this Owner
Home Financials are based on the most recent Mortgage that was taken out on this home.
Original Mortgage
$225,000
Interest Rate
7.03%
Purchase Details
Closed on
Feb 6, 1997
Sold by
Lange Laurie A
Bought by
Lange Laurie and Lange Richard
Purchase Details
Closed on
Sep 6, 1996
Sold by
Lange Laurie A and Bower Laurie A
Bought by
Lange Laurie A
Purchase Details
Closed on
Nov 3, 1994
Sold by
Olson Paul C and Schnaubelt Loretta
Bought by
Bower Laurie A and Laurie A Bower Trust #1
Create a Home Valuation Report for This Property
The Home Valuation Report is an in-depth analysis detailing your home's value as well as a comparison with similar homes in the area
Home Values in the Area
Average Home Value in this Area
Purchase History
| Date | Buyer | Sale Price | Title Company |
|---|---|---|---|
| Fischer Brian E | $385,000 | -- | |
| Brindley Gerry L | $325,000 | -- | |
| Lange Laurie | -- | Inter County Title Co | |
| Lange Laurie A | -- | Chicago Title Insurance Co | |
| Bower Laurie A | $57,500 | Chicago Title Insurance Co |
Source: Public Records
Mortgage History
| Date | Status | Borrower | Loan Amount |
|---|---|---|---|
| Previous Owner | Brindley Gerry L | $225,000 |
Source: Public Records
Tax History Compared to Growth
Tax History
| Year | Tax Paid | Tax Assessment Tax Assessment Total Assessment is a certain percentage of the fair market value that is determined by local assessors to be the total taxable value of land and additions on the property. | Land | Improvement |
|---|---|---|---|---|
| 2024 | $11,254 | $162,456 | $31,322 | $131,134 |
| 2023 | $10,761 | $146,953 | $28,333 | $118,620 |
| 2022 | $10,555 | $135,463 | $24,917 | $110,546 |
| 2021 | $10,452 | $130,869 | $24,072 | $106,797 |
| 2020 | $10,406 | $128,517 | $23,639 | $104,878 |
| 2019 | $10,396 | $126,855 | $23,333 | $103,522 |
| 2018 | $10,660 | $125,454 | $24,106 | $101,348 |
| 2017 | $10,376 | $120,945 | $23,495 | $97,450 |
| 2016 | $11,003 | $118,076 | $22,938 | $95,138 |
| 2015 | -- | $111,498 | $22,938 | $88,560 |
| 2014 | -- | $121,325 | $22,938 | $98,387 |
| 2013 | -- | $123,398 | $23,330 | $100,068 |
Source: Public Records
Map
Nearby Homes
- 1853 Chandolin Ln
- 1831 Chandolin Ln
- 1855 Chandolin Ln
- 41W591 Lenz Rd
- 10N874 Rippburger Rd
- 41W072 Bowes Rd
- 44W669 Ramm Rd
- 4378 John Milton Rd
- 40W513 Old Mill Ct
- 10N701 Prairie Crossing
- 9N954 Heatherington Place
- 3689 Thornhill Dr
- 41W455 Brierwood Dr
- 40W156 Sturbridge Way
- 44W005 Ellithorpe Rd
- 3646 Thornhill Dr
- 2 Stonecrest Dr
- 3584 Tournament Dr
- 300 Astor Ct
- 312 Astor Ct
- 43W030 Carletta Ln
- 43W140 Carletta Ln
- 43W069 Carletta Ln
- 9N450 Carletta Ln
- 9N590 Kendall Rd
- 43W031 Carletta Ln
- 43W084 Southgate Rd
- 43W040 Southgate Rd
- Lot Kendall Rd
- 9N523 Kendall Rd
- 9N670 Kendall Rd
- 10514 Kendall Rd
- 10514 Kendall Rd
- 43W081 Southgate Rd
- 225 Kendall Rd
- 43W043 Southgate Rd
- 43W023 Southgate Rd
- 43W151 Southgate Rd
- 9N467 Kendall Rd
- 9N623 Kendall Rd