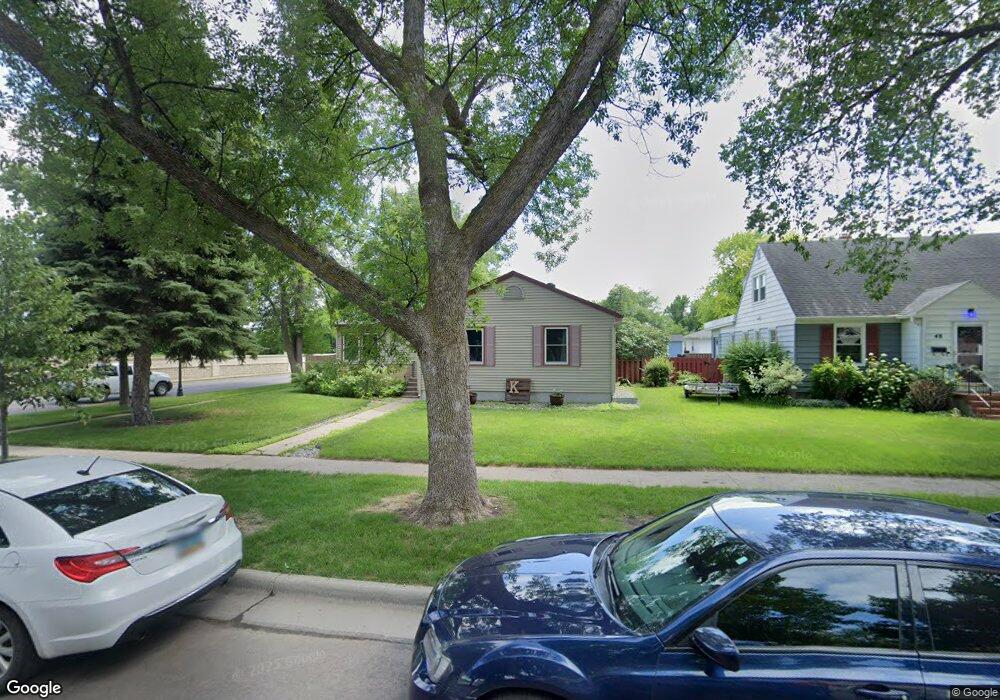
44 16th Ave N Fargo, ND 58102
Washington NeighborhoodEstimated Value: $255,388 - $292,000
4
Beds
2
Baths
1,136
Sq Ft
$241/Sq Ft
Est. Value
About This Home
This home is located at 44 16th Ave N, Fargo, ND 58102 and is currently estimated at $274,097, approximately $241 per square foot. 44 16th Ave N is a home located in Cass County with nearby schools including Washington Elementary School, Ben Franklin Middle School, and North High School.
Ownership History
Date
Name
Owned For
Owner Type
Purchase Details
Closed on
Jul 31, 2012
Sold by
Kemper David P and Kemper Katie
Bought by
Kempler David P and Kemper Katie
Current Estimated Value
Purchase Details
Closed on
Apr 14, 2010
Sold by
Enderle Enderle Heather Heather and Enderle Kemper Heather
Bought by
Kemper David
Purchase Details
Closed on
May 25, 2006
Sold by
Burggraff David E and Burggraff Donna J
Bought by
Kemper David P and Enderle Kemper Heather A
Home Financials for this Owner
Home Financials are based on the most recent Mortgage that was taken out on this home.
Original Mortgage
$142,900
Interest Rate
6.56%
Mortgage Type
New Conventional
Create a Home Valuation Report for This Property
The Home Valuation Report is an in-depth analysis detailing your home's value as well as a comparison with similar homes in the area
Home Values in the Area
Average Home Value in this Area
Purchase History
| Date | Buyer | Sale Price | Title Company |
|---|---|---|---|
| Kempler David P | -- | None Available | |
| Kemper David | -- | -- | |
| Kemper David P | $142,900 | -- |
Source: Public Records
Mortgage History
| Date | Status | Borrower | Loan Amount |
|---|---|---|---|
| Previous Owner | Kemper David P | $142,900 |
Source: Public Records
Tax History
| Year | Tax Paid | Tax Assessment Tax Assessment Total Assessment is a certain percentage of the fair market value that is determined by local assessors to be the total taxable value of land and additions on the property. | Land | Improvement |
|---|---|---|---|---|
| 2024 | $3,257 | $125,150 | $24,550 | $100,600 |
| 2023 | $3,434 | $113,750 | $24,550 | $89,200 |
| 2022 | $3,282 | $106,300 | $24,550 | $81,750 |
| 2021 | $3,098 | $100,300 | $24,550 | $75,750 |
| 2020 | $2,936 | $95,500 | $24,550 | $70,950 |
| 2019 | $2,939 | $95,500 | $13,650 | $81,850 |
| 2018 | $2,661 | $86,050 | $13,650 | $72,400 |
| 2017 | $2,492 | $80,400 | $13,650 | $66,750 |
| 2016 | $2,148 | $73,100 | $13,650 | $59,450 |
| 2015 | $2,263 | $73,100 | $10,250 | $62,850 |
| 2014 | $2,251 | $70,800 | $10,250 | $60,550 |
| 2013 | $2,166 | $67,450 | $10,250 | $57,200 |
Source: Public Records
Map
Nearby Homes
- 77 18th Ave N
- 1306 Elm St N
- 1345 3rd St N
- 1349 4th St N
- 1345 4th St N
- 1245 1st St N
- 1249 2nd St N
- 1647 Broadway N
- 1441 Broadway N Unit 203
- 1437 Broadway N Unit 101
- 3216 Broadway N
- 1257 4th St N
- 2411 Country Club Pkwy
- 1630 7th St N
- 301 21st Ave N
- 801 17th Ave N
- 1009 18th Ave N
- 105 24th Ave N
- 1125 5th St N
- 1525 10th St N
Your Personal Tour Guide
Ask me questions while you tour the home.