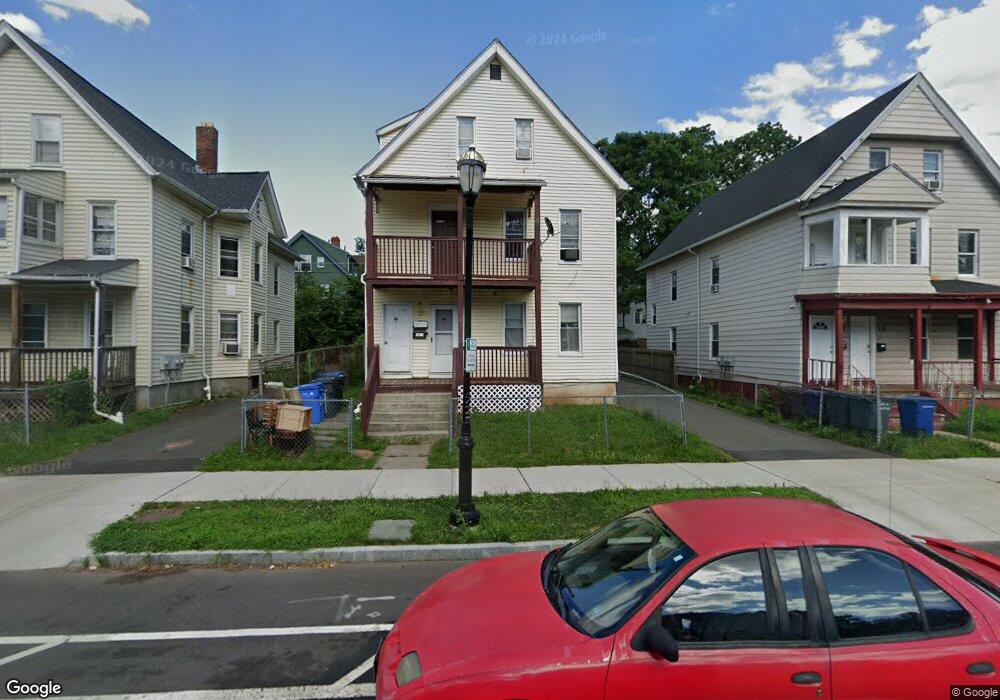
44-46 Franklin Ave Unit 1st floor Hartford, CT 06114
Sheldon Charter Oak NeighborhoodEstimated Value: $362,000 - $431,000
3
Beds
1
Bath
1,200
Sq Ft
$335/Sq Ft
Est. Value
About This Home
This home is located at 44-46 Franklin Ave Unit 1st floor, Hartford, CT 06114 and is currently estimated at $402,455, approximately $335 per square foot. 44-46 Franklin Ave Unit 1st floor is a home located in Hartford County with nearby schools including M. D. Fox School, Asian Studies School At Dwight/Belizzi School, and Dr. James H Naylor/Ccsu Leadership Academy.
Ownership History
Date
Name
Owned For
Owner Type
Purchase Details
Closed on
Dec 3, 2020
Sold by
Lopez Adolfo
Bought by
Reque-Lopez Hugo A
Current Estimated Value
Home Financials for this Owner
Home Financials are based on the most recent Mortgage that was taken out on this home.
Original Mortgage
$218,762
Outstanding Balance
$194,667
Interest Rate
2.8%
Mortgage Type
FHA
Estimated Equity
$207,788
Purchase Details
Closed on
Feb 13, 2004
Sold by
Wright Voncille
Bought by
Florez Jose
Purchase Details
Closed on
May 7, 1991
Sold by
Rodriguez Juan and Rodriguez Margarita
Bought by
Palomino Wilfredo and Barzola Susana
Create a Home Valuation Report for This Property
The Home Valuation Report is an in-depth analysis detailing your home's value as well as a comparison with similar homes in the area
Home Values in the Area
Average Home Value in this Area
Purchase History
| Date | Buyer | Sale Price | Title Company |
|---|---|---|---|
| Reque-Lopez Hugo A | $255,000 | None Available | |
| Reque-Lopez Hugo A | $255,000 | None Available | |
| Florez Jose | $160,000 | -- | |
| Florez Jose | $160,000 | -- | |
| Palomino Wilfredo | $149,900 | -- | |
| Palomino Wilfredo | $149,900 | -- |
Source: Public Records
Mortgage History
| Date | Status | Borrower | Loan Amount |
|---|---|---|---|
| Open | Reque-Lopez Hugo A | $218,762 | |
| Previous Owner | Palomino Wilfredo | $9,400 |
Source: Public Records
Tax History Compared to Growth
Tax History
| Year | Tax Paid | Tax Assessment Tax Assessment Total Assessment is a certain percentage of the fair market value that is determined by local assessors to be the total taxable value of land and additions on the property. | Land | Improvement |
|---|---|---|---|---|
| 2025 | $6,307 | $91,471 | $4,263 | $87,208 |
| 2024 | $6,307 | $91,471 | $4,263 | $87,208 |
| 2023 | $6,307 | $91,471 | $4,263 | $87,208 |
| 2022 | $6,307 | $91,471 | $4,263 | $87,208 |
| 2021 | $3,565 | $47,985 | $5,670 | $42,315 |
| 2020 | $3,565 | $47,985 | $5,670 | $42,315 |
| 2019 | $3,565 | $47,985 | $5,670 | $42,315 |
| 2018 | $3,445 | $46,367 | $5,479 | $40,888 |
| 2016 | $3,336 | $44,901 | $5,218 | $39,683 |
| 2015 | $3,177 | $42,768 | $4,970 | $37,798 |
| 2014 | $3,100 | $41,722 | $4,848 | $36,874 |
Source: Public Records
Map
Nearby Homes
- 71 Franklin Ave
- 68 Morris St Unit 102
- 67 Congress St Unit C
- 3 Pawtucket St
- 51 Congress St Unit A
- 30 Shultas Place Unit 32
- 31 Wethersfield Ave Unit I
- 49 Benton St
- 10 Warner St
- 14 Wethersfield Ave
- 2 Wethersfield Ave
- 27 Allen Place
- 9 Madison St
- 155 Seymour St Unit 157
- 356 Wethersfield Ave
- 34 Lisbon St
- 213 Franklin Ave Unit 405
- 18 School St Unit 20
- 42 Madison St
- 17 Bond St
- 48 Franklin Ave Unit 50
- 44 Franklin Ave Unit 46
- 54 Franklin Ave Unit 56
- 40 Franklin Ave Unit 42
- 45 Dean St Unit 47
- 52 Franklin Ave
- 36 Franklin Ave Unit 38
- 36 Franklin Ave Unit 2
- 53 Dean St Unit 55
- 41 Dean St Unit 43
- 41-43 Dean St
- 32 Franklin Ave Unit 34
- 61 Dean St Unit 63
- 30 Franklin Ave
- 53 Franklin Ave
- 68 Franklin Ave Unit 70
- 39 Franklin Ave Unit 41
- 60 Dean St
- 56 Annawan St Unit 58
- 56 Annawan St Unit 3rd Floor