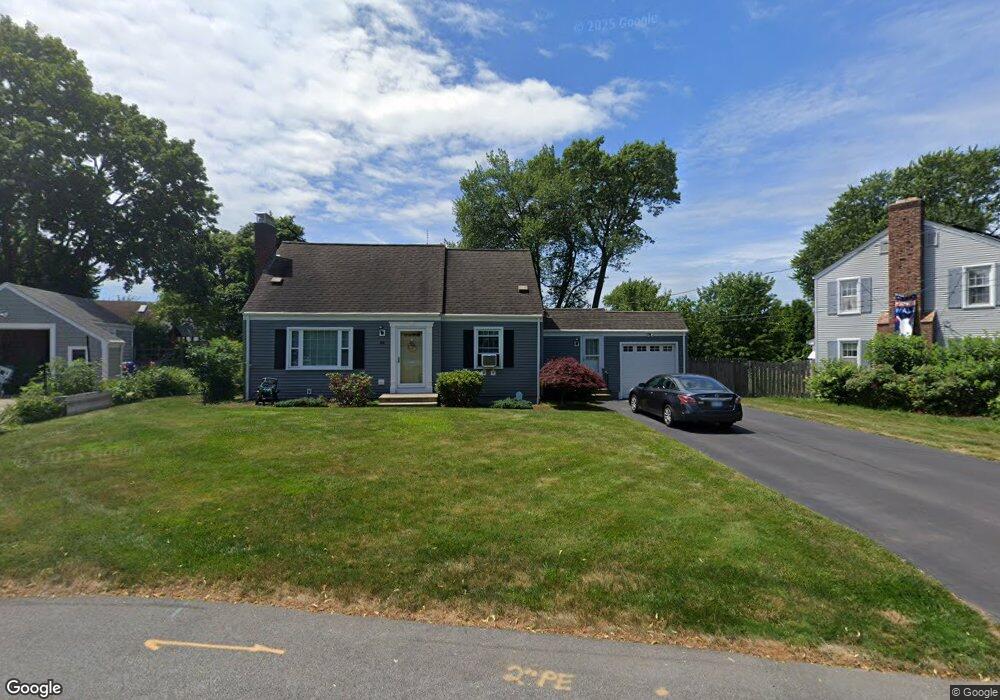
44 Algonquin Rd Rumford, RI 02916
Estimated Value: $432,000 - $551,000
3
Beds
2
Baths
1,567
Sq Ft
$308/Sq Ft
Est. Value
About This Home
This home is located at 44 Algonquin Rd, Rumford, RI 02916 and is currently estimated at $483,012, approximately $308 per square foot. 44 Algonquin Rd is a home located in Providence County with nearby schools including East Providence High School, St Margaret School, and Ocean State Montessori School.
Ownership History
Date
Name
Owned For
Owner Type
Purchase Details
Closed on
Mar 29, 2002
Sold by
David Elizabeth Est
Bought by
Campbell Holly M and Campbell Shawn
Current Estimated Value
Home Financials for this Owner
Home Financials are based on the most recent Mortgage that was taken out on this home.
Original Mortgage
$144,000
Interest Rate
6.88%
Create a Home Valuation Report for This Property
The Home Valuation Report is an in-depth analysis detailing your home's value as well as a comparison with similar homes in the area
Home Values in the Area
Average Home Value in this Area
Purchase History
| Date | Buyer | Sale Price | Title Company |
|---|---|---|---|
| Campbell Holly M | $180,000 | -- |
Source: Public Records
Mortgage History
| Date | Status | Borrower | Loan Amount |
|---|---|---|---|
| Open | Campbell Holly M | $195,000 | |
| Closed | Campbell Holly M | $143,400 | |
| Closed | Campbell Holly M | $144,000 |
Source: Public Records
Tax History Compared to Growth
Tax History
| Year | Tax Paid | Tax Assessment Tax Assessment Total Assessment is a certain percentage of the fair market value that is determined by local assessors to be the total taxable value of land and additions on the property. | Land | Improvement |
|---|---|---|---|---|
| 2024 | $5,077 | $331,200 | $77,800 | $253,400 |
| 2023 | $4,889 | $331,200 | $77,800 | $253,400 |
| 2022 | $5,207 | $238,200 | $57,300 | $180,900 |
| 2021 | $5,121 | $238,200 | $56,500 | $181,700 |
| 2020 | $4,905 | $238,200 | $56,500 | $181,700 |
| 2019 | $4,769 | $238,200 | $56,500 | $181,700 |
| 2018 | $4,626 | $202,200 | $65,200 | $137,000 |
| 2017 | $4,523 | $202,200 | $65,200 | $137,000 |
| 2016 | $4,501 | $202,200 | $65,200 | $137,000 |
| 2015 | $4,420 | $192,600 | $60,300 | $132,300 |
| 2014 | $4,420 | $192,600 | $60,300 | $132,300 |
Source: Public Records
Map
Nearby Homes
- 48 Hobson Ave
- 71 Priscilla Ave
- 10 Linden Ave
- 41 What Cheer Ave
- 62 Byron Ave
- 169 Wilmarth Ave
- 125 Roger Williams Ave
- 200 Woodward Ave
- 661 N Broadway
- 141 E Point Dr Unit 206
- 141 E Point Dr Unit 108
- 141 E Point Dr Unit 401
- 141 E Point Dr Unit 212
- 141 E Point Dr Unit 105
- 141 E Point Dr Unit 110
- 141 E Point Dr Unit 306
- 141 E Point Dr Unit 406
- 141 E Point Dr Unit 404
- 141 E Point Dr Unit 101
- 141 E Point Dr Unit 311
- 40 Algonquin Rd
- 2 Sutcliffe Cir
- 26 Larchmere Dr
- 30 Larchmere Dr
- 34 Larchmere Dr
- 6 Sutcliffe Cir
- 43 Algonquin Rd
- 22 Larchmere Dr
- 36 Algonquin Rd
- 53 Algonquin Rd
- 38 Larchmere Dr
- 18 Larchmere Dr
- 2 Redway Cir
- 32 Algonquin Rd
- 54 Algonquin Rd
- 42 Larchmere Dr
- 29 Larchmere Dr
- 61 Algonquin Rd
- 10 Sutcliffe Cir
- 25 Larchmere Dr