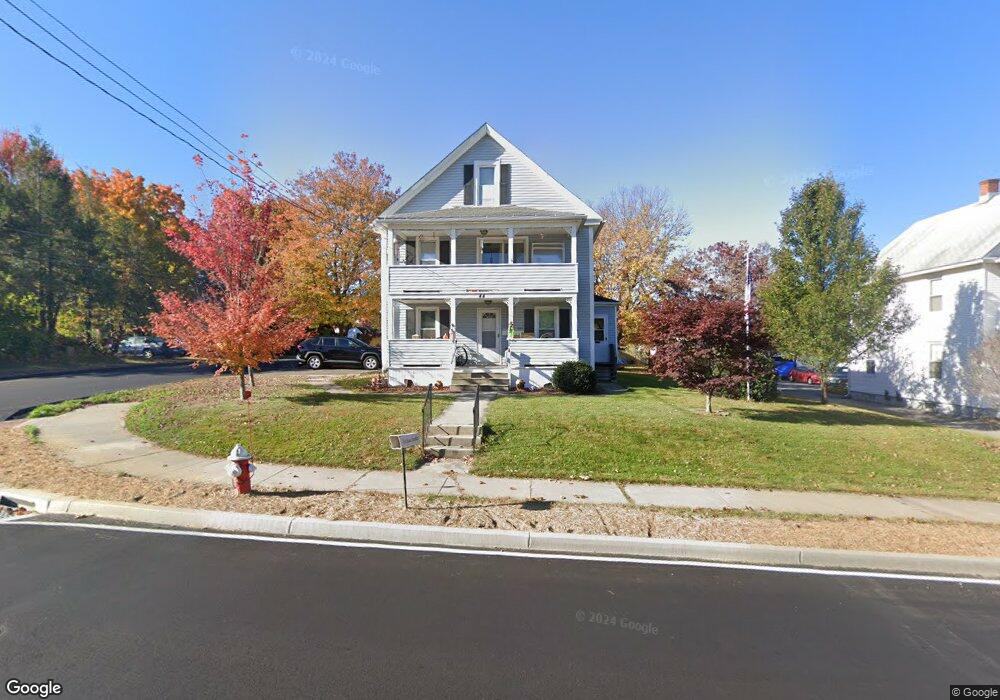
44 Allen St Terryville, CT 06786
Estimated Value: $245,000 - $400,000
4
Beds
2
Baths
1,872
Sq Ft
$171/Sq Ft
Est. Value
About This Home
This home is located at 44 Allen St, Terryville, CT 06786 and is currently estimated at $319,223, approximately $170 per square foot. 44 Allen St is a home located in Litchfield County with nearby schools including Harry S. Fisher Elementary School, Eli Terry Jr. Middle School, and Terryville High School.
Ownership History
Date
Name
Owned For
Owner Type
Purchase Details
Closed on
Jul 31, 1997
Sold by
Zalaski Matthew E
Bought by
Beverley Noel
Current Estimated Value
Purchase Details
Closed on
Aug 8, 1991
Sold by
Zalaski Joseph A and Zalaski Lois Ann
Bought by
Zalaski Matthew E
Create a Home Valuation Report for This Property
The Home Valuation Report is an in-depth analysis detailing your home's value as well as a comparison with similar homes in the area
Home Values in the Area
Average Home Value in this Area
Purchase History
| Date | Buyer | Sale Price | Title Company |
|---|---|---|---|
| Beverley Noel | $97,000 | -- | |
| Beverley Noel | $97,000 | -- | |
| Zalaski Matthew E | $125,000 | -- |
Source: Public Records
Mortgage History
| Date | Status | Borrower | Loan Amount |
|---|---|---|---|
| Open | Zalaski Matthew E | $144,400 | |
| Closed | Zalaski Matthew E | $150,400 | |
| Closed | Zalaski Matthew E | $67,000 |
Source: Public Records
Tax History Compared to Growth
Tax History
| Year | Tax Paid | Tax Assessment Tax Assessment Total Assessment is a certain percentage of the fair market value that is determined by local assessors to be the total taxable value of land and additions on the property. | Land | Improvement |
|---|---|---|---|---|
| 2025 | $4,864 | $122,920 | $42,770 | $80,150 |
| 2024 | $4,750 | $122,920 | $42,770 | $80,150 |
| 2023 | $4,634 | $122,920 | $42,770 | $80,150 |
| 2022 | $4,464 | $122,920 | $42,770 | $80,150 |
| 2021 | $4,415 | $108,675 | $43,960 | $64,715 |
| 2020 | $4,415 | $108,675 | $43,960 | $64,715 |
| 2019 | $4,415 | $108,675 | $43,960 | $64,715 |
| 2016 | $4,029 | $111,853 | $43,960 | $67,893 |
| 2015 | $3,901 | $110,103 | $43,960 | $66,143 |
| 2014 | $3,837 | $110,103 | $43,960 | $66,143 |
Source: Public Records
Map
Nearby Homes