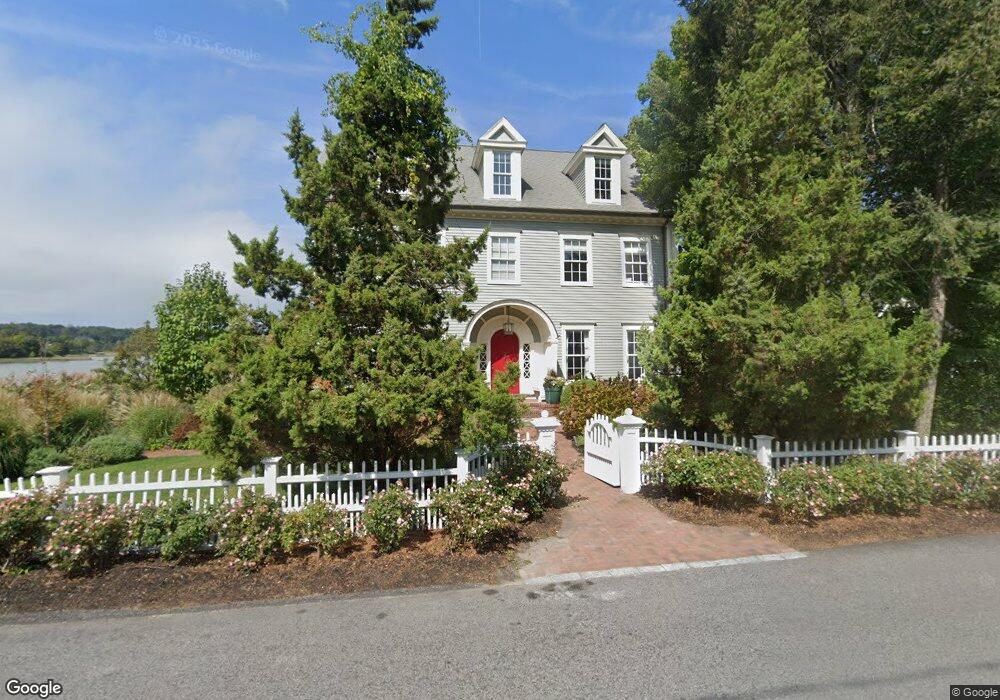
44 Beach St Cohasset, MA 02025
Estimated Value: $2,986,000 - $4,117,000
4
Beds
2
Baths
3,219
Sq Ft
$1,149/Sq Ft
Est. Value
About This Home
This home is located at 44 Beach St, Cohasset, MA 02025 and is currently estimated at $3,698,766, approximately $1,149 per square foot. 44 Beach St is a home located in Norfolk County with nearby schools including Joseph Osgood School, Deer Hill School, and Cohasset Middle School.
Ownership History
Date
Name
Owned For
Owner Type
Purchase Details
Closed on
Dec 16, 2004
Sold by
Gormley Jeanne T and Perkins Matthew W
Bought by
Sayer Jennifer E and Ognibene Paul M
Current Estimated Value
Home Financials for this Owner
Home Financials are based on the most recent Mortgage that was taken out on this home.
Original Mortgage
$1,576,000
Outstanding Balance
$786,634
Interest Rate
5.68%
Mortgage Type
Purchase Money Mortgage
Estimated Equity
$2,912,132
Create a Home Valuation Report for This Property
The Home Valuation Report is an in-depth analysis detailing your home's value as well as a comparison with similar homes in the area
Home Values in the Area
Average Home Value in this Area
Purchase History
| Date | Buyer | Sale Price | Title Company |
|---|---|---|---|
| Sayer Jennifer E | $1,100,000 | -- |
Source: Public Records
Mortgage History
| Date | Status | Borrower | Loan Amount |
|---|---|---|---|
| Open | Sayer Jennifer E | $1,576,000 |
Source: Public Records
Tax History Compared to Growth
Tax History
| Year | Tax Paid | Tax Assessment Tax Assessment Total Assessment is a certain percentage of the fair market value that is determined by local assessors to be the total taxable value of land and additions on the property. | Land | Improvement |
|---|---|---|---|---|
| 2025 | $41,057 | $3,545,500 | $1,913,500 | $1,632,000 |
| 2024 | $42,949 | $3,529,100 | $2,394,200 | $1,134,900 |
| 2023 | $40,343 | $3,418,900 | $2,302,200 | $1,116,700 |
| 2022 | $41,721 | $3,321,700 | $2,302,200 | $1,019,500 |
| 2021 | $40,300 | $3,090,500 | $2,302,200 | $788,300 |
| 2020 | $39,549 | $3,049,300 | $2,302,200 | $747,100 |
| 2019 | $38,995 | $3,022,900 | $2,302,200 | $720,700 |
| 2018 | $29,899 | $2,337,700 | $1,617,000 | $720,700 |
| 2017 | $29,109 | $2,228,900 | $1,539,700 | $689,200 |
| 2016 | $28,708 | $2,228,900 | $1,539,700 | $689,200 |
| 2015 | $23,827 | $1,874,700 | $1,185,500 | $689,200 |
| 2014 | $23,509 | $1,874,700 | $1,185,500 | $689,200 |
Source: Public Records
Map
Nearby Homes
- 11 Beach St
- 135 Beach St
- 25 Mohawk Way
- 17 Mohawk Way
- 89 Ripley Rd
- 128 Elm St Unit 211
- 21-23 Elm Ct
- 146 N Main St Unit 146
- 25 Ripley Rd
- 15 Cushing Rd
- 87 Elm St Unit 215
- 124 Elm St Unit 202
- 124 Elm St Unit 308
- 104 Howard Gleason Rd
- 26 Ash St
- 100 Howard Gleason Rd
- 101 Nichols Rd
- 119 Pleasant St
- 98 Black Horse Ln
- 40 Pond St