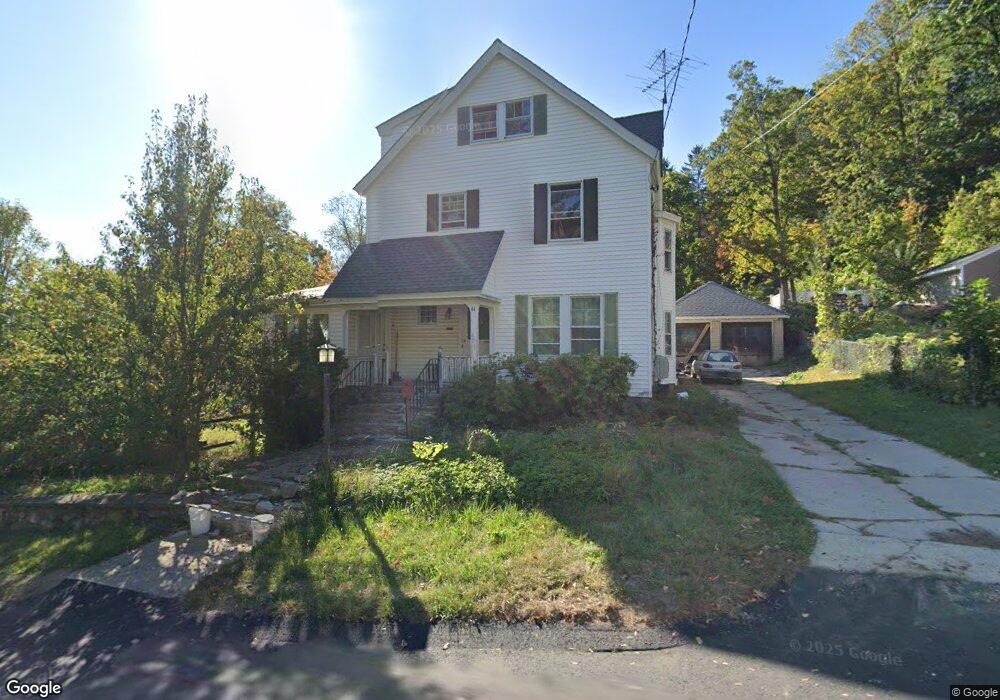
44 Bond St Fitchburg, MA 01420
Estimated Value: $409,000 - $469,000
5
Beds
4
Baths
2,157
Sq Ft
$207/Sq Ft
Est. Value
About This Home
This home is located at 44 Bond St, Fitchburg, MA 01420 and is currently estimated at $446,766, approximately $207 per square foot. 44 Bond St is a home located in Worcester County with nearby schools including Crocker Elementary School, South Street Elementary School, and Reingold Elementary School.
Ownership History
Date
Name
Owned For
Owner Type
Purchase Details
Closed on
Sep 27, 2002
Sold by
Goldsmith Steven P
Bought by
Loudermilk Gary
Current Estimated Value
Home Financials for this Owner
Home Financials are based on the most recent Mortgage that was taken out on this home.
Original Mortgage
$192,479
Outstanding Balance
$81,226
Interest Rate
6.25%
Mortgage Type
Purchase Money Mortgage
Estimated Equity
$365,540
Purchase Details
Closed on
Mar 31, 1987
Sold by
Benson John P
Bought by
Goldsmith S P
Home Financials for this Owner
Home Financials are based on the most recent Mortgage that was taken out on this home.
Original Mortgage
$134,800
Interest Rate
9.03%
Mortgage Type
Purchase Money Mortgage
Create a Home Valuation Report for This Property
The Home Valuation Report is an in-depth analysis detailing your home's value as well as a comparison with similar homes in the area
Home Values in the Area
Average Home Value in this Area
Purchase History
| Date | Buyer | Sale Price | Title Company |
|---|---|---|---|
| Loudermilk Gary | $195,500 | -- | |
| Goldsmith S P | $168,500 | -- |
Source: Public Records
Mortgage History
| Date | Status | Borrower | Loan Amount |
|---|---|---|---|
| Open | Goldsmith S P | $192,479 | |
| Previous Owner | Goldsmith S P | $80,000 | |
| Previous Owner | Goldsmith S P | $134,800 |
Source: Public Records
Tax History Compared to Growth
Tax History
| Year | Tax Paid | Tax Assessment Tax Assessment Total Assessment is a certain percentage of the fair market value that is determined by local assessors to be the total taxable value of land and additions on the property. | Land | Improvement |
|---|---|---|---|---|
| 2025 | $50 | $369,600 | $84,200 | $285,400 |
| 2024 | $5,065 | $342,000 | $56,700 | $285,300 |
| 2023 | $4,832 | $301,600 | $46,800 | $254,800 |
| 2022 | $4,688 | $266,200 | $38,200 | $228,000 |
| 2021 | $4,489 | $235,900 | $32,000 | $203,900 |
| 2020 | $4,389 | $222,700 | $29,600 | $193,100 |
| 2019 | $4,227 | $206,300 | $39,400 | $166,900 |
| 2018 | $4,084 | $194,400 | $37,000 | $157,400 |
| 2017 | $3,810 | $177,300 | $33,300 | $144,000 |
| 2016 | $3,613 | $170,200 | $32,000 | $138,200 |
| 2015 | $3,509 | $169,700 | $30,800 | $138,900 |
| 2014 | $3,365 | $169,700 | $30,800 | $138,900 |
Source: Public Records
Map
Nearby Homes
- 59 Arlington St
- 47 Arlington St
- 39 Arlington St
- 58 Arlington St Unit 60
- 13-15 Chestnut St
- 90 Mechanic St
- 151 Mechanic St
- 33-35 Omena Place
- 205-207 High St
- 68 Marshall St
- 195 Marshall St
- 62 Grove St
- 7 Valleyview Ct Unit 3
- 230 Kimball St
- 11 Beech Street Ln
- 58 Oliver St
- 5 Jay St
- 34 Garnet St
- 58 (A B) Oliver St
- 79 Beech St