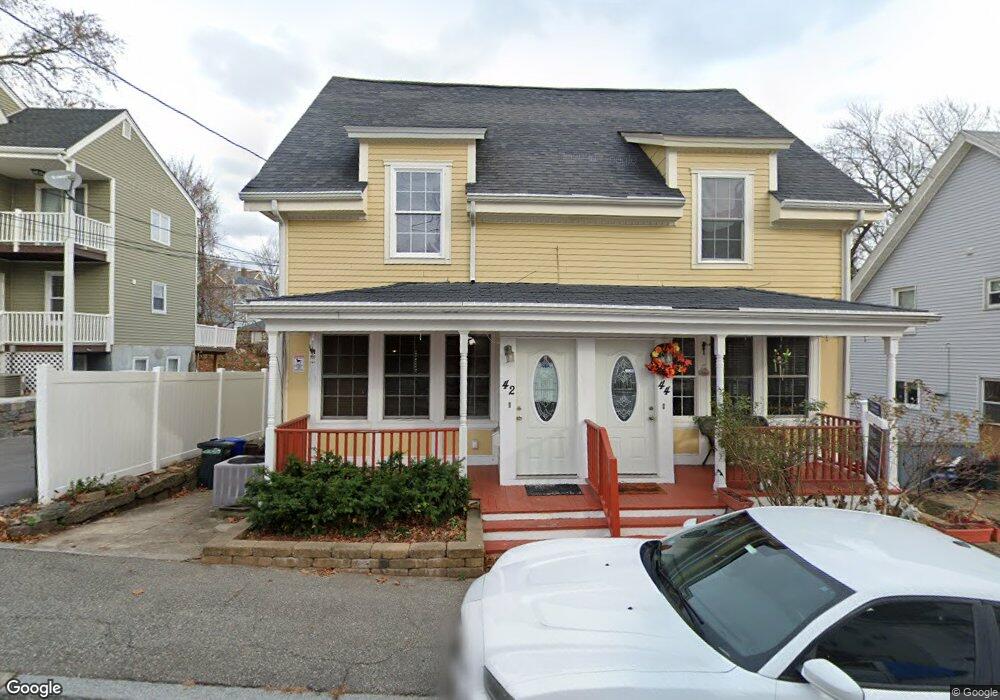
44 Buckley St Unit A Quincy, MA 02169
South Quincy NeighborhoodEstimated Value: $500,000 - $752,000
2
Beds
3
Baths
1,084
Sq Ft
$535/Sq Ft
Est. Value
About This Home
This home is located at 44 Buckley St Unit A, Quincy, MA 02169 and is currently estimated at $579,887, approximately $534 per square foot. 44 Buckley St Unit A is a home located in Norfolk County with nearby schools including Lincoln-Hancock Community School, South West Middle School, and Quincy High School.
Ownership History
Date
Name
Owned For
Owner Type
Purchase Details
Closed on
Jan 7, 2021
Sold by
Stanley Ahjegannie and Sterling-George Beverley
Bought by
Ball Samantha J and Kamin David C
Current Estimated Value
Home Financials for this Owner
Home Financials are based on the most recent Mortgage that was taken out on this home.
Original Mortgage
$413,500
Outstanding Balance
$368,985
Interest Rate
2.7%
Mortgage Type
Purchase Money Mortgage
Estimated Equity
$210,902
Purchase Details
Closed on
Nov 22, 2013
Sold by
Fhlmc
Bought by
Stanley Ahjegannie and Dix Beverley
Home Financials for this Owner
Home Financials are based on the most recent Mortgage that was taken out on this home.
Original Mortgage
$277,400
Interest Rate
4.25%
Mortgage Type
New Conventional
Purchase Details
Closed on
Jun 25, 2010
Sold by
Demirtas Ozgur
Bought by
Fhlmc
Purchase Details
Closed on
Aug 23, 2005
Sold by
Mccarthy Thomas and Haufler William
Bought by
Demirtas Ozgur
Home Financials for this Owner
Home Financials are based on the most recent Mortgage that was taken out on this home.
Original Mortgage
$311,200
Interest Rate
5.66%
Mortgage Type
Purchase Money Mortgage
Create a Home Valuation Report for This Property
The Home Valuation Report is an in-depth analysis detailing your home's value as well as a comparison with similar homes in the area
Home Values in the Area
Average Home Value in this Area
Purchase History
| Date | Buyer | Sale Price | Title Company |
|---|---|---|---|
| Ball Samantha J | $460,000 | None Available | |
| Stanley Ahjegannie | $292,000 | -- | |
| Fhlmc | $231,000 | -- | |
| Demirtas Ozgur | $389,000 | -- |
Source: Public Records
Mortgage History
| Date | Status | Borrower | Loan Amount |
|---|---|---|---|
| Open | Ball Samantha J | $413,500 | |
| Previous Owner | Stanley Ahjegannie | $277,400 | |
| Previous Owner | Demirtas Ozgur | $311,200 | |
| Previous Owner | Demirtas Ozgur | $77,800 |
Source: Public Records
Tax History Compared to Growth
Tax History
| Year | Tax Paid | Tax Assessment Tax Assessment Total Assessment is a certain percentage of the fair market value that is determined by local assessors to be the total taxable value of land and additions on the property. | Land | Improvement |
|---|---|---|---|---|
| 2025 | $5,692 | $493,700 | $0 | $493,700 |
| 2024 | $5,313 | $471,400 | $0 | $471,400 |
| 2023 | $4,911 | $441,200 | $0 | $441,200 |
| 2022 | $4,924 | $411,000 | $0 | $411,000 |
| 2021 | $4,871 | $401,200 | $0 | $401,200 |
| 2020 | $4,828 | $388,400 | $0 | $388,400 |
| 2019 | $4,679 | $372,800 | $0 | $372,800 |
| 2018 | $4,609 | $345,500 | $0 | $345,500 |
| 2017 | $4,601 | $324,700 | $0 | $324,700 |
| 2016 | $4,918 | $342,500 | $0 | $342,500 |
| 2015 | $4,894 | $335,200 | $0 | $335,200 |
| 2014 | $4,636 | $312,000 | $0 | $312,000 |
Source: Public Records
Map
Nearby Homes
- 46-48 Buckley St
- 57 Buckley St
- 14 Arthur Ave
- 46 Suomi Rd
- 46 Suomi Rd Unit 46
- 12 Arthur Ave
- 21 Arthur St
- 42 West St
- 91 Garfield St
- 211 Copeland St
- 64 Garfield St Unit B
- 1 Cityview Ln Unit 506
- 1 Cityview Ln Unit 210
- 1 Cityview Ln Unit 709
- 1 Cityview Ln Unit 204
- 510 Willard St
- 94 Brook Rd Unit 3
- 211 West St Unit 12B
- 25 Carrolls Ln
- 51 Brook Rd
- 44 Buckley St Unit B
- 42 Buckley St Unit A
- 48 Buckley St Unit 48
- 46 Buckley St
- 46 Buckley St Unit 2
- 40 Buckley St
- 40 Buckley St Unit 40
- 38 Buckley St Unit 38
- 40 Buckley St Unit 1
- 38 Buckley St
- 41 Buckley St
- 52 Buckley St Unit 52
- 50 Buckley St
- 50 Buckley St Unit 2
- 50 Buckley St Unit 50
- 43 Nelson St
- 32 Buckley St
- 32 Buckley St Unit 3
- 32 Buckley St Unit 2
- 29 Buckley St