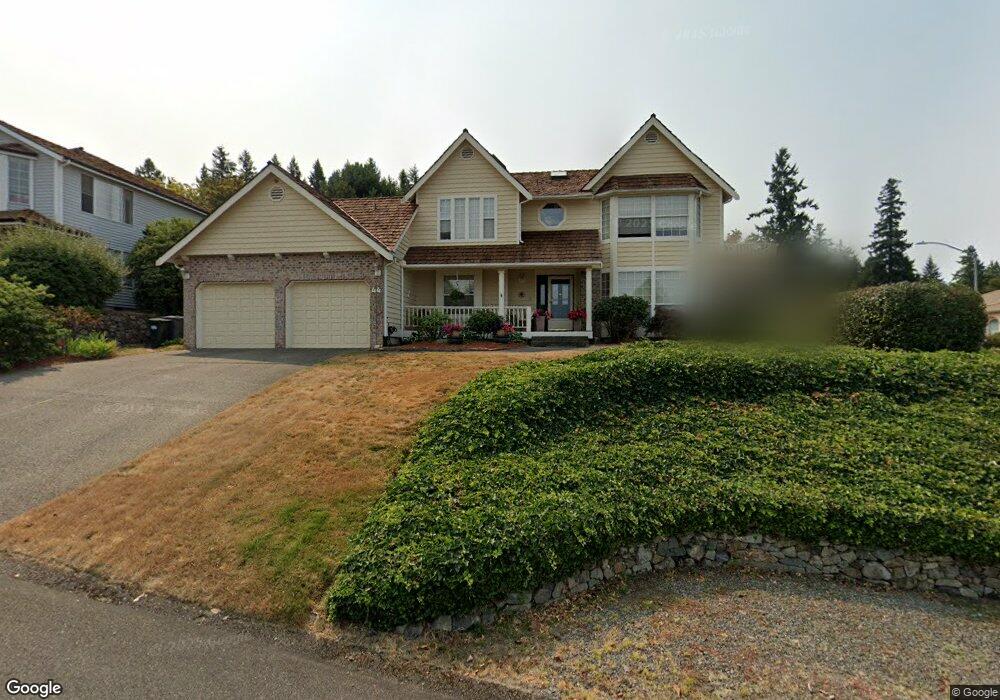
44 Chapman Loop Steilacoom, WA 98388
Estimated Value: $923,000 - $988,000
4
Beds
3
Baths
2,742
Sq Ft
$347/Sq Ft
Est. Value
About This Home
This home is located at 44 Chapman Loop, Steilacoom, WA 98388 and is currently estimated at $952,096, approximately $347 per square foot. 44 Chapman Loop is a home located in Pierce County with nearby schools including Saltars Point Elementary School, Cherrydale Elementary School, and Pioneer Middle School.
Ownership History
Date
Name
Owned For
Owner Type
Purchase Details
Closed on
Jul 22, 2025
Sold by
Morris Scott R and Morris Susan E
Bought by
Morris Living Trust and Morris
Current Estimated Value
Purchase Details
Closed on
Jul 5, 2000
Sold by
Neilan Robert J
Bought by
Morris Scott R and Morris Susan E
Home Financials for this Owner
Home Financials are based on the most recent Mortgage that was taken out on this home.
Original Mortgage
$252,700
Interest Rate
8.63%
Create a Home Valuation Report for This Property
The Home Valuation Report is an in-depth analysis detailing your home's value as well as a comparison with similar homes in the area
Home Values in the Area
Average Home Value in this Area
Purchase History
| Date | Buyer | Sale Price | Title Company |
|---|---|---|---|
| Morris Living Trust | -- | None Listed On Document | |
| Morris Scott R | $362,000 | -- |
Source: Public Records
Mortgage History
| Date | Status | Borrower | Loan Amount |
|---|---|---|---|
| Previous Owner | Morris Scott R | $252,700 |
Source: Public Records
Tax History
| Year | Tax Paid | Tax Assessment Tax Assessment Total Assessment is a certain percentage of the fair market value that is determined by local assessors to be the total taxable value of land and additions on the property. | Land | Improvement |
|---|---|---|---|---|
| 2025 | $7,702 | $937,000 | $445,900 | $491,100 |
| 2024 | $7,702 | $918,700 | $437,000 | $481,700 |
| 2023 | $7,702 | $894,500 | $461,300 | $433,200 |
| 2022 | $7,460 | $900,900 | $476,200 | $424,700 |
| 2021 | $7,650 | $710,200 | $383,900 | $326,300 |
| 2019 | $7,029 | $659,900 | $339,800 | $320,100 |
| 2018 | $7,376 | $634,700 | $295,300 | $339,400 |
| 2017 | $6,623 | $579,900 | $259,200 | $320,700 |
| 2016 | $6,132 | $546,000 | $240,400 | $305,600 |
| 2014 | $6,154 | $477,600 | $199,200 | $278,400 |
| 2013 | $6,154 | $459,600 | $183,300 | $276,300 |
Source: Public Records
Map
Nearby Homes
- 126 Cormorant Dr
- 1083 5th St Unit 4A
- 601 Chris David Dr
- 1023 4th St
- 616 Chris David Dr
- 710 Chris David Dr
- 709 Chris David Dr
- 814 5th St
- 1307 Walnut Ln
- 501 3rd St
- 714 Union Ave
- 718 Union Ave
- 0 Morris Blvd Unit NWM2268127
- 10318 Morris Blvd
- 1410 Beech Ave
- 2009 Nisqually St
- 728 Blaine St
- 1514 Rainier St
- 11210 111th St SW
- 715 Stevens St
- 0 L5 W Shore Ct
- 46 W Shore Ct
- 6 W Shore Ct
- 42 Chapman Loop
- 50 West Shore Ct
- 46 Chapman Loop
- 27 W Shore Ct
- 47 Chapman Loop
- 27 West Shore Ct
- 46 West Shore Ct
- 40 Chapman Loop
- 45 Chapman Loop
- 49 Chapman Loop
- 48 Chapman Loop
- 42 W Shore Ct
- 42 West Shore Ct
- 25 West Shore Ct
- 25 W Shore Ct
- 85 Chapman Loop
- 50 Chapman Loop
Your Personal Tour Guide
Ask me questions while you tour the home.