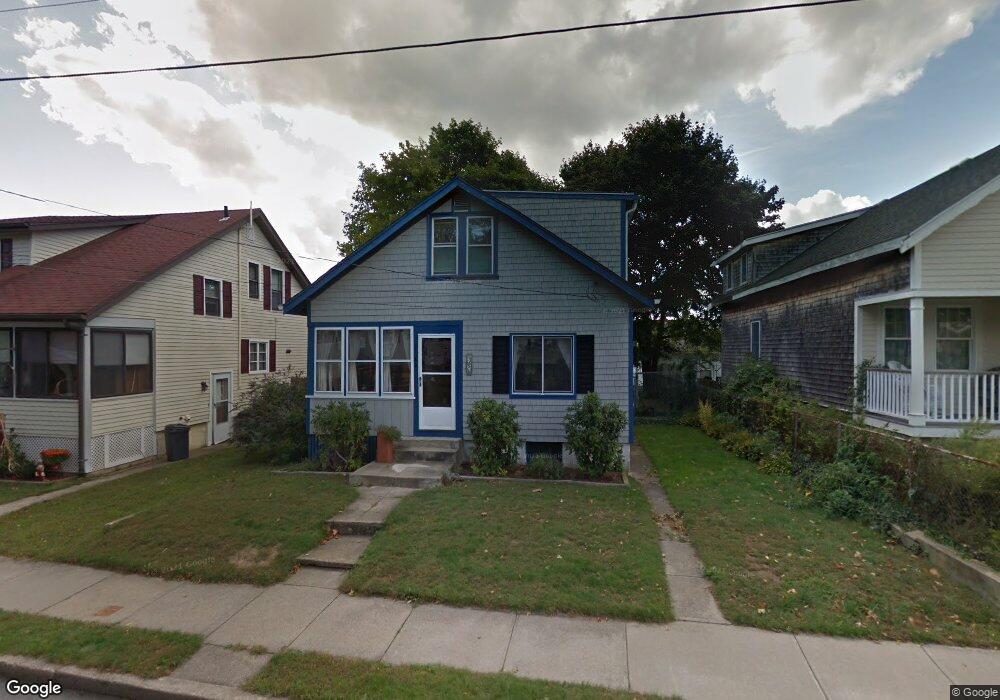
44 Cherry St Fairhaven, MA 02719
Oxford NeighborhoodEstimated Value: $428,747 - $481,000
2
Beds
1
Bath
1,555
Sq Ft
$297/Sq Ft
Est. Value
About This Home
This home is located at 44 Cherry St, Fairhaven, MA 02719 and is currently estimated at $461,937, approximately $297 per square foot. 44 Cherry St is a home located in Bristol County with nearby schools including Fairhaven High School, Alma Del Mar Charter School, and City On A Hill Charter Public School New Bedford.
Ownership History
Date
Name
Owned For
Owner Type
Purchase Details
Closed on
Dec 8, 2016
Sold by
Souza Richard F
Bought by
Richard F Souza Ret
Current Estimated Value
Purchase Details
Closed on
Dec 3, 1992
Sold by
Souza Richard F and Souza Rebecca L
Bought by
Souza Richard F
Home Financials for this Owner
Home Financials are based on the most recent Mortgage that was taken out on this home.
Original Mortgage
$55,000
Interest Rate
8.22%
Mortgage Type
Purchase Money Mortgage
Create a Home Valuation Report for This Property
The Home Valuation Report is an in-depth analysis detailing your home's value as well as a comparison with similar homes in the area
Home Values in the Area
Average Home Value in this Area
Purchase History
| Date | Buyer | Sale Price | Title Company |
|---|---|---|---|
| Richard F Souza Ret | -- | -- | |
| Souza Richard F | $37,100 | -- |
Source: Public Records
Mortgage History
| Date | Status | Borrower | Loan Amount |
|---|---|---|---|
| Previous Owner | Souza Richard F | $65,000 | |
| Previous Owner | Souza Richard F | $55,000 |
Source: Public Records
Tax History
| Year | Tax Paid | Tax Assessment Tax Assessment Total Assessment is a certain percentage of the fair market value that is determined by local assessors to be the total taxable value of land and additions on the property. | Land | Improvement |
|---|---|---|---|---|
| 2025 | $29 | $308,200 | $167,700 | $140,500 |
| 2024 | $2,774 | $300,500 | $167,700 | $132,800 |
| 2023 | $2,698 | $271,200 | $146,900 | $124,300 |
| 2022 | $2,609 | $255,300 | $136,500 | $118,800 |
| 2021 | $2,654 | $216,900 | $123,500 | $93,400 |
| 2020 | $2,399 | $216,900 | $123,500 | $93,400 |
| 2019 | $2,486 | $187,800 | $102,400 | $85,400 |
| 2018 | $7,033 | $179,200 | $97,500 | $81,700 |
| 2017 | $6,987 | $173,500 | $97,500 | $76,000 |
| 2016 | $2,029 | $166,600 | $97,500 | $69,100 |
| 2015 | $2,010 | $165,400 | $97,500 | $67,900 |
Source: Public Records
Map
Nearby Homes
- 442 Dana Farms
- 14 Sycamore St
- 313 Main St
- 24 Academy Ave
- 253 Adams St
- 10 Livesey Pkwy
- 138 Main St Unit 13
- 71 Sycamore St
- 15 School St
- 16 Ash St
- 34 Washburn St Unit 36
- 24 Cotter St
- 67 Bridge St
- 39 Christian St
- 239 Sawyer St
- 1301 Pleasant St Unit 1305
- 77 Adams St
- 1441 Pleasant St
- 8 Washington St
- 272 Sawyer St
Your Personal Tour Guide
Ask me questions while you tour the home.