Estimated Value: $757,107 - $875,000
3
Beds
2
Baths
1,810
Sq Ft
$455/Sq Ft
Est. Value
About This Home
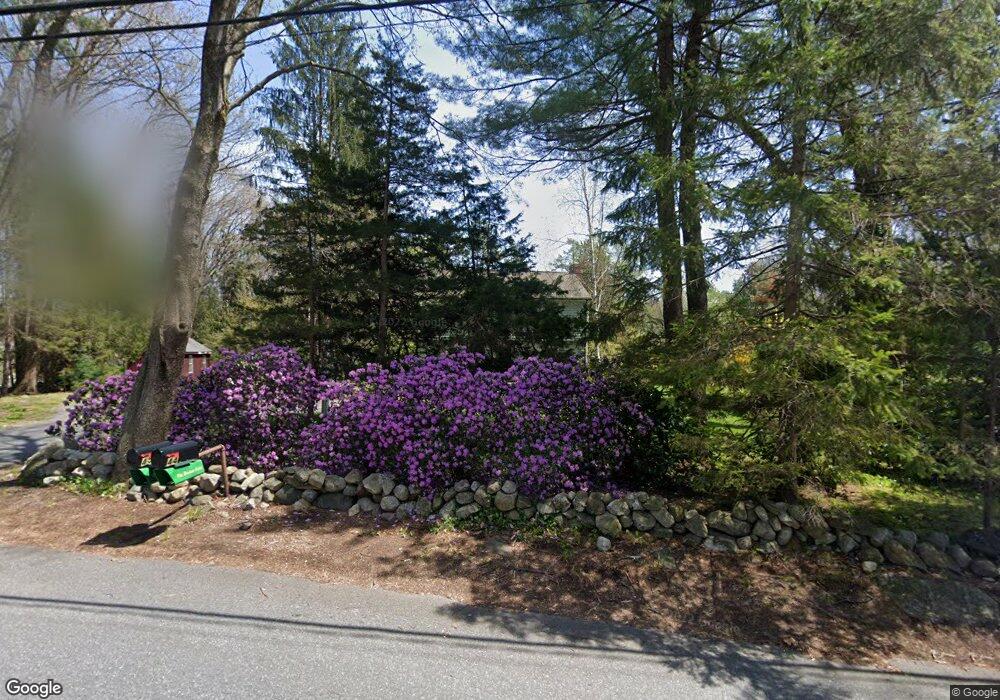
This home is located at 44 Conant St, Acton, MA 01720 and is currently estimated at $824,027, approximately $455 per square foot. 44 Conant St is a home located in Middlesex County with nearby schools including Acton-Boxborough Regional High School, Maynard Knowledge Beginnings, and The Imago School.
Ownership History
Date
Name
Owned For
Owner Type
Purchase Details
Closed on
Sep 26, 2025
Sold by
Green Elizabeth D and Green Paul G
Bought by
Elizabeth D Green Ret and Green
Current Estimated Value
Purchase Details
Closed on
May 24, 2006
Sold by
Green Elizabeth D
Bought by
Green Elizabeth D and Green Paul G
Home Financials for this Owner
Home Financials are based on the most recent Mortgage that was taken out on this home.
Original Mortgage
$200,000
Interest Rate
6.53%
Mortgage Type
Purchase Money Mortgage
Create a Home Valuation Report for This Property
The Home Valuation Report is an in-depth analysis detailing your home's value as well as a comparison with similar homes in the area
Home Values in the Area
Average Home Value in this Area
Purchase History
| Date | Buyer | Sale Price | Title Company |
|---|---|---|---|
| Elizabeth D Green Ret | -- | -- | |
| Green Elizabeth D | -- | -- | |
| Green Elizabeth D | $520,000 | -- | |
| Green Elizabeth D | -- | -- | |
| Green Elizabeth D | $520,000 | -- |
Source: Public Records
Mortgage History
| Date | Status | Borrower | Loan Amount |
|---|---|---|---|
| Previous Owner | Green Elizabeth D | $200,000 |
Source: Public Records
Tax History
| Year | Tax Paid | Tax Assessment Tax Assessment Total Assessment is a certain percentage of the fair market value that is determined by local assessors to be the total taxable value of land and additions on the property. | Land | Improvement |
|---|---|---|---|---|
| 2025 | $11,921 | $695,100 | $358,000 | $337,100 |
| 2024 | $11,229 | $673,600 | $358,000 | $315,600 |
| 2023 | $10,917 | $621,700 | $325,900 | $295,800 |
| 2022 | $10,519 | $540,800 | $283,500 | $257,300 |
| 2021 | $10,244 | $506,400 | $262,700 | $243,700 |
| 2020 | $9,678 | $503,000 | $262,700 | $240,300 |
| 2019 | $9,176 | $473,700 | $262,700 | $211,000 |
| 2018 | $9,052 | $467,100 | $262,700 | $204,400 |
| 2017 | $8,840 | $463,800 | $262,700 | $201,100 |
| 2016 | $8,836 | $459,500 | $262,700 | $196,800 |
| 2015 | $9,007 | $472,800 | $262,700 | $210,100 |
| 2014 | $8,799 | $452,400 | $262,700 | $189,700 |
Source: Public Records
Map
Nearby Homes
- 63 Conant St
- 36 Brown St
- 1 Carlton Dr
- 30 Brewster Ln
- 40 High St
- 12 Brown St
- 70 Powder Mill Rd
- 68 Powder Mill Rd
- 1 Drummer Rd Unit A5
- 130 Parker St Unit J2
- 70 River St
- 1 Vanderbelt Rd
- 131 Main St
- 129 Main St Unit 129
- 31 Drummer Rd Unit 31
- 2 Wall Ct
- 25 Nylander Way
- 23 Deer Path Unit 5
- 7 Hillcrest Dr
- 6 Nancy Cir
Your Personal Tour Guide
Ask me questions while you tour the home.