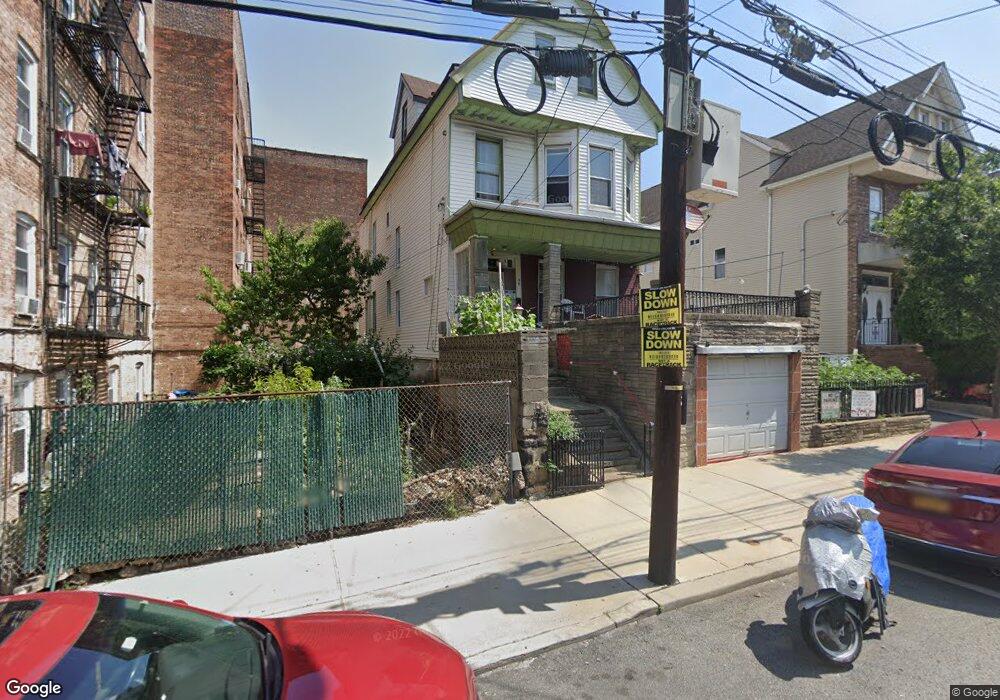
44 Cooper Place Unit 46 Weehawken, NJ 07086
Estimated Value: $967,117 - $1,590,000
--
Bed
--
Bath
2,663
Sq Ft
$489/Sq Ft
Est. Value
About This Home
This home is located at 44 Cooper Place Unit 46, Weehawken, NJ 07086 and is currently estimated at $1,302,029, approximately $488 per square foot. 44 Cooper Place Unit 46 is a home located in Hudson County with nearby schools including Daniel Webster School, Theodore Roosevelt School, and Weehawken High School.
Ownership History
Date
Name
Owned For
Owner Type
Purchase Details
Closed on
Mar 31, 2005
Sold by
Ozsen Mutlu and Ozsen Cindy
Bought by
Ozsen Mutlu and Ozsen Cindy
Current Estimated Value
Purchase Details
Closed on
Jan 16, 1997
Sold by
Ocwen Federal Bank Fsb
Bought by
Ozsen Mutlu
Home Financials for this Owner
Home Financials are based on the most recent Mortgage that was taken out on this home.
Original Mortgage
$128,000
Interest Rate
7.57%
Purchase Details
Closed on
Sep 16, 1996
Sold by
Cassidy Joseph T
Bought by
Berkeley Federal Bank & Trust Fsb
Home Financials for this Owner
Home Financials are based on the most recent Mortgage that was taken out on this home.
Original Mortgage
$266,554
Interest Rate
8.06%
Create a Home Valuation Report for This Property
The Home Valuation Report is an in-depth analysis detailing your home's value as well as a comparison with similar homes in the area
Home Values in the Area
Average Home Value in this Area
Purchase History
| Date | Buyer | Sale Price | Title Company |
|---|---|---|---|
| Ozsen Mutlu | -- | None Available | |
| Ozsen Mutlu | $160,000 | -- | |
| Berkeley Federal Bank & Trust Fsb | -- | -- |
Source: Public Records
Mortgage History
| Date | Status | Borrower | Loan Amount |
|---|---|---|---|
| Closed | Ozsen Mutlu | $128,000 | |
| Previous Owner | Berkeley Federal Bank & Trust Fsb | $266,554 |
Source: Public Records
Tax History Compared to Growth
Tax History
| Year | Tax Paid | Tax Assessment Tax Assessment Total Assessment is a certain percentage of the fair market value that is determined by local assessors to be the total taxable value of land and additions on the property. | Land | Improvement |
|---|---|---|---|---|
| 2025 | $16,046 | $793,200 | $395,700 | $397,500 |
| 2024 | $15,348 | $793,200 | $395,700 | $397,500 |
| 2023 | $15,348 | $793,200 | $395,700 | $397,500 |
| 2022 | $14,730 | $793,200 | $395,700 | $397,500 |
| 2021 | $14,508 | $793,200 | $395,700 | $397,500 |
| 2020 | $14,262 | $793,200 | $395,700 | $397,500 |
| 2019 | $13,603 | $793,200 | $395,700 | $397,500 |
| 2018 | $13,595 | $793,200 | $395,700 | $397,500 |
| 2017 | $13,510 | $255,000 | $185,000 | $70,000 |
| 2016 | $12,903 | $255,000 | $185,000 | $70,000 |
| 2015 | $12,929 | $255,000 | $185,000 | $70,000 |
| 2014 | $12,482 | $255,000 | $185,000 | $70,000 |
Source: Public Records
Map
Nearby Homes
- 53 Cooper Place
- 4508 Brown St Unit 1R
- 47 47th St Unit 9
- 4401 Park Ave Unit 5F
- 74-76 Clifton Terrace
- 4700-6 Broadway
- 130 45th St Unit 3
- 130 45th St Unit 4
- 130 45th St Unit 2
- 16-18 Fulton St
- 123 47th St
- 4711 Broadway Unit 1
- 29 48th St
- 27 48th St
- 21-23 48th St
- 963-965 Jfk Blvd E Unit 4-3
- 963 Boulevard E Unit 2-3
- 963 Blvd E Unit 2-3
- 963 Blvd E Unit 4-3
- 201 45th St Unit E7
- 40 Cooper Place Unit 42
- 40 Cooper Place Unit 42
- 40 Cooper Place Unit 42
- 40 Cooper Place Unit 42
- 40 Cooper Place Unit 42
- 40 Cooper Place Unit 42
- 40 Cooper Place Unit 42
- 40 Cooper Place Unit 42
- 40 Cooper Place Unit 42
- 40 Cooper Place Unit 2
- 40 Cooper Place Unit 3
- 40 Cooper Place
- 40 Cooper Place Unit 1
- 51 Cooper Pl 101
- 4522 Park Ave
- 36 Cooper Place Unit 38
- 75-77 46th St
- 75 46th St Unit 77
- 75-77 46th St Unit 35
- 75-77 46th St Unit 43