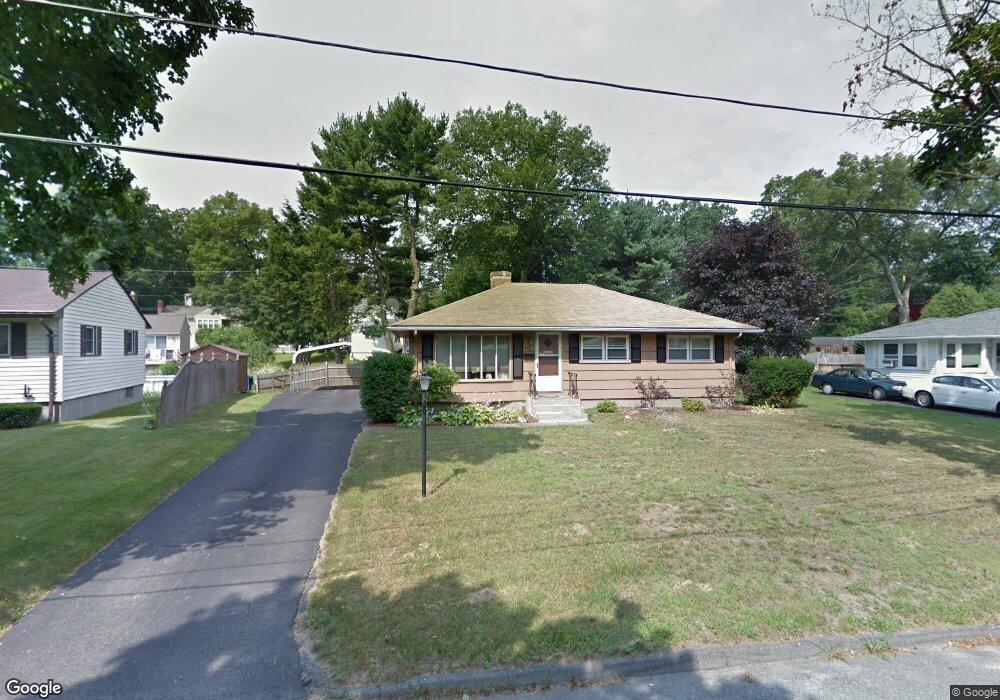
44 Crestlan Cir Worcester, MA 01604
Broadmeadow Brook NeighborhoodEstimated Value: $401,920 - $447,000
3
Beds
1
Bath
1,120
Sq Ft
$381/Sq Ft
Est. Value
About This Home
This home is located at 44 Crestlan Cir, Worcester, MA 01604 and is currently estimated at $426,730, approximately $381 per square foot. 44 Crestlan Cir is a home located in Worcester County with nearby schools including Roosevelt Elementary School, Jacob Hiatt Magnet School, and Chandler Magnet.
Ownership History
Date
Name
Owned For
Owner Type
Purchase Details
Closed on
Mar 17, 2003
Sold by
White Kenneth J and White Naomi J
Bought by
Vanbiene Karl
Current Estimated Value
Home Financials for this Owner
Home Financials are based on the most recent Mortgage that was taken out on this home.
Original Mortgage
$189,900
Outstanding Balance
$81,995
Interest Rate
5.94%
Mortgage Type
Purchase Money Mortgage
Estimated Equity
$344,735
Purchase Details
Closed on
Jul 30, 1998
Sold by
White Maroin and White Joseph L
Bought by
White Kenneth J and Strom Naomi J
Home Financials for this Owner
Home Financials are based on the most recent Mortgage that was taken out on this home.
Original Mortgage
$99,000
Interest Rate
6.92%
Mortgage Type
Purchase Money Mortgage
Create a Home Valuation Report for This Property
The Home Valuation Report is an in-depth analysis detailing your home's value as well as a comparison with similar homes in the area
Home Values in the Area
Average Home Value in this Area
Purchase History
| Date | Buyer | Sale Price | Title Company |
|---|---|---|---|
| Vanbiene Karl | $189,900 | -- | |
| White Kenneth J | $110,000 | -- |
Source: Public Records
Mortgage History
| Date | Status | Borrower | Loan Amount |
|---|---|---|---|
| Open | White Kenneth J | $189,900 | |
| Previous Owner | White Kenneth J | $21,000 | |
| Previous Owner | White Kenneth J | $116,000 | |
| Previous Owner | White Kenneth J | $99,000 |
Source: Public Records
Tax History
| Year | Tax Paid | Tax Assessment Tax Assessment Total Assessment is a certain percentage of the fair market value that is determined by local assessors to be the total taxable value of land and additions on the property. | Land | Improvement |
|---|---|---|---|---|
| 2025 | $4,587 | $347,800 | $118,400 | $229,400 |
| 2024 | $4,507 | $327,800 | $118,400 | $209,400 |
| 2023 | $4,431 | $309,000 | $102,900 | $206,100 |
| 2022 | $3,938 | $258,900 | $82,400 | $176,500 |
| 2021 | $3,780 | $232,200 | $65,900 | $166,300 |
| 2020 | $3,648 | $214,600 | $65,900 | $148,700 |
| 2019 | $3,442 | $191,200 | $59,300 | $131,900 |
| 2018 | $3,357 | $177,500 | $59,300 | $118,200 |
| 2017 | $3,400 | $176,900 | $59,300 | $117,600 |
| 2016 | $3,184 | $154,500 | $43,400 | $111,100 |
| 2015 | $3,101 | $154,500 | $43,400 | $111,100 |
| 2014 | $3,019 | $154,500 | $43,400 | $111,100 |
Source: Public Records
Map
Nearby Homes
- 2 Salisbury St
- 15 Lakeside Dr
- 11 Maplewood Rd
- 1459 Grafton Rd
- 6 Nathaniel St
- 62 Edgemere Blvd
- 1195 Grafton St Unit 29
- 1195 Grafton St Unit 19
- 1195 Grafton St Unit 39
- 7 Clarissa St
- 7 Barbara St
- 151 Hartford Turnpike
- 151 Hartford Turnpike Unit 16
- 9 Marissa Cir
- 16 Amherst St
- 365 Lake Ave
- 12 Irene Ct
- 8 Nightview Place
- 194 Worcester St
- 47 Orchard Meadow Dr
- 48 Crestlan Cir
- 40 Crestlan Cir
- 75 Westborough St
- 73 Westborough St
- 71 Westborough St
- 79 Westborough St
- 36 Crestlan Cir
- 5 Pine Crest Dr
- 45 Crestlan Cir
- 65 Crestlan Cir
- 11 Pine Crest Dr
- 37 Crestlan Cir
- 81 Westborough St
- 74 Westborough St
- 74A Westborough St
- 32 Crestlan Cir
- 69 Westborough St
- 69 Westborough St Unit 69
- 15 Pine Crest Dr
- 76 Westborough St
Your Personal Tour Guide
Ask me questions while you tour the home.