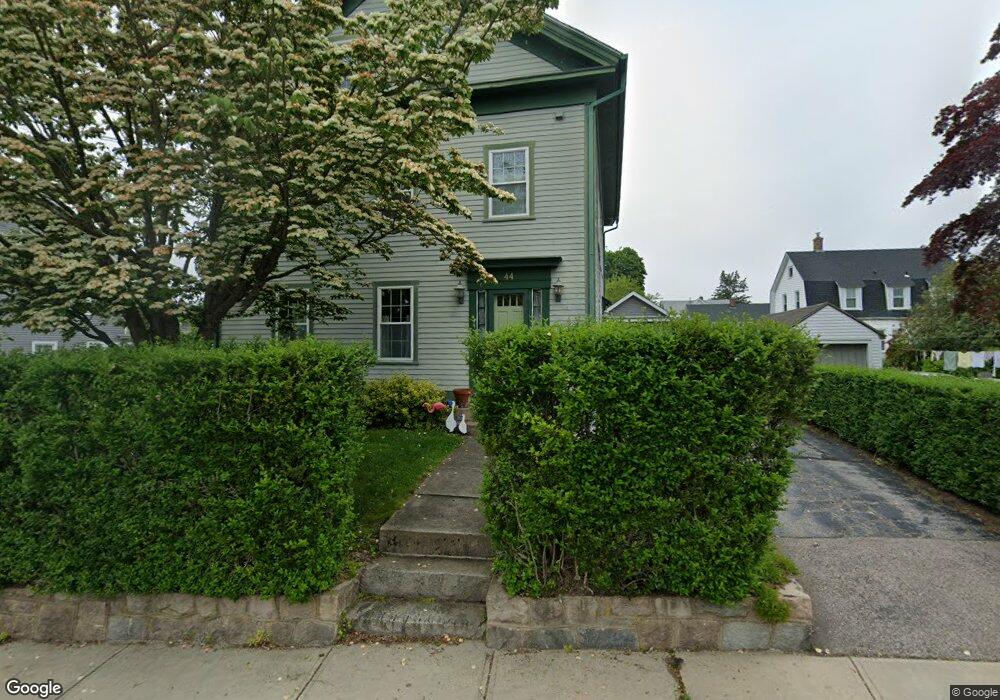
44 Cross St Westerly, RI 02891
Estimated Value: $551,000 - $652,000
4
Beds
3
Baths
2,363
Sq Ft
$254/Sq Ft
Est. Value
About This Home
This home is located at 44 Cross St, Westerly, RI 02891 and is currently estimated at $599,711, approximately $253 per square foot. 44 Cross St is a home located in Washington County with nearby schools including Westerly High School.
Ownership History
Date
Name
Owned For
Owner Type
Purchase Details
Closed on
Feb 7, 1995
Sold by
Frink Felene E
Bought by
Frink James N and Call Erin C
Current Estimated Value
Purchase Details
Closed on
Mar 29, 1990
Sold by
Guardino Susan C
Bought by
Frink James N
Create a Home Valuation Report for This Property
The Home Valuation Report is an in-depth analysis detailing your home's value as well as a comparison with similar homes in the area
Home Values in the Area
Average Home Value in this Area
Purchase History
| Date | Buyer | Sale Price | Title Company |
|---|---|---|---|
| Frink James N | $62,500 | -- | |
| Frink James N | $126,000 | -- |
Source: Public Records
Mortgage History
| Date | Status | Borrower | Loan Amount |
|---|---|---|---|
| Open | Frink James N | $100,000 | |
| Closed | Frink James N | $15,000 | |
| Closed | Frink James N | $110,000 |
Source: Public Records
Tax History
| Year | Tax Paid | Tax Assessment Tax Assessment Total Assessment is a certain percentage of the fair market value that is determined by local assessors to be the total taxable value of land and additions on the property. | Land | Improvement |
|---|---|---|---|---|
| 2025 | $3,766 | $484,000 | $153,000 | $331,000 |
| 2024 | $3,661 | $350,300 | $109,600 | $240,700 |
| 2023 | $3,559 | $350,300 | $109,600 | $240,700 |
| 2022 | $3,538 | $350,300 | $109,600 | $240,700 |
| 2021 | $3,552 | $294,500 | $95,500 | $199,000 |
| 2020 | $3,490 | $294,500 | $95,500 | $199,000 |
| 2019 | $3,457 | $294,500 | $95,500 | $199,000 |
| 2018 | $3,092 | $250,400 | $95,500 | $154,900 |
| 2017 | $3,005 | $250,400 | $95,500 | $154,900 |
| 2016 | $3,005 | $250,400 | $95,500 | $154,900 |
| 2015 | $2,889 | $257,300 | $97,400 | $159,900 |
| 2014 | $2,843 | $257,300 | $97,400 | $159,900 |
Source: Public Records
Map
Nearby Homes
- 14 George St
- 16 Spring St
- 25 School St Unit 2
- 38 Prospect St Unit B
- 21 North Dr
- 52 Bellevue Ave
- 15 Moss St
- 19 Crestview Dr Unit C
- 13 Moss St
- 7 Dixon St
- 23 Abbey Ln Unit 12
- 141 W Broad St
- 24 Abbey Ln Unit 13
- 22 Colonial Dr
- 12 Apache Dr Unit A
- 33 Whipple Ave
- 55 Pleasant St
- 2 Marichris Dr
- 17 Apache Dr Unit G
- 19 Apache Dr Unit F
Your Personal Tour Guide
Ask me questions while you tour the home.