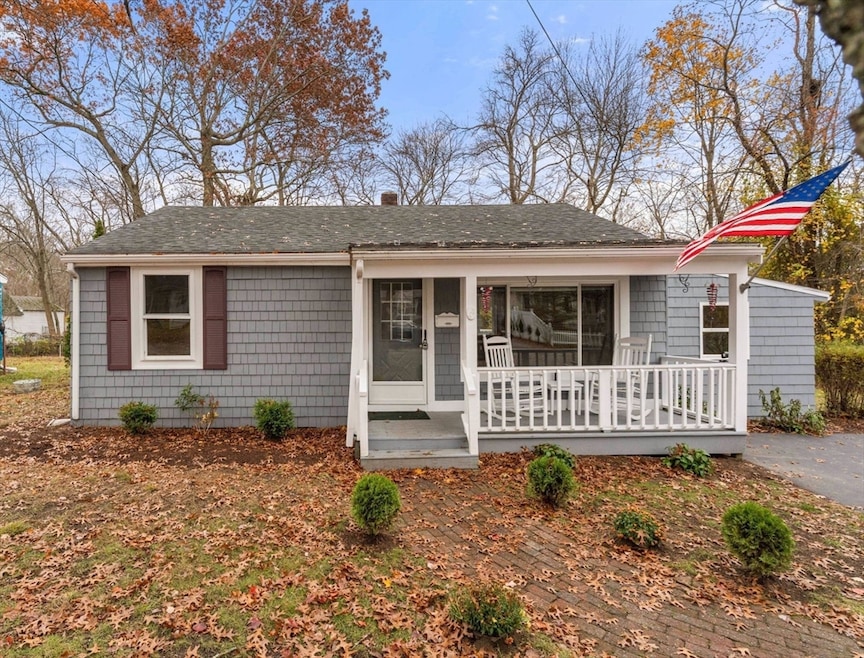
44 Dawes Rd Brockton, MA 02301
Estimated payment $2,424/month
Highlights
- Hot Property
- Deck
- Ranch Style House
- Medical Services
- Wooded Lot
- Wood Flooring
About This Home
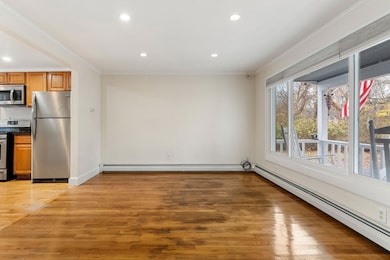
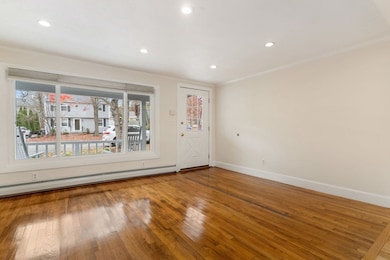
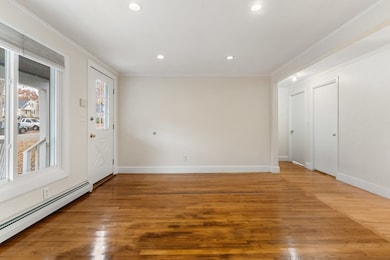
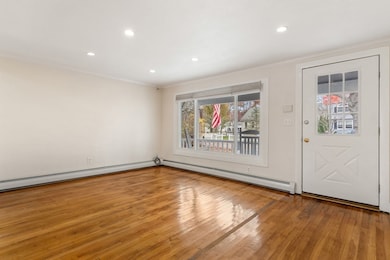
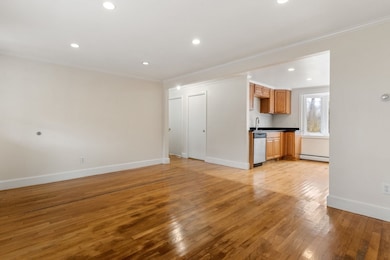
Charming 2 bedroom, 1 bath ranch offering one-level living on a quiet, tree-lined street! This cozy home features hardwood floors throughout, a bright open-concept kitchen/living area with stainless steel appliances, granite counters, and a large picture window that fills the space with natural light. Enjoy outdoor living on the lovely farmer’s porch or the spacious back deck overlooking a private yet manageable yard with a shed! Recent updates include newer windows, roof, heating system, and hot water tank—giving peace of mind for years to come. Conveniently located just 1.5 miles from Rt. 24 and moments from the Westgate Mall. This home is a wonderful opportunity to make your own!
Home Details
Home Type
- Single Family
Est. Annual Taxes
- $3,789
Year Built
- Built in 1952
Lot Details
- 5,227 Sq Ft Lot
- Wooded Lot
Home Design
- 900 Sq Ft Home
- Ranch Style House
- Frame Construction
- Shingle Roof
- Concrete Perimeter Foundation
Kitchen
- Range
- Microwave
- Freezer
- Dishwasher
- Disposal
Flooring
- Wood
- Laminate
- Tile
Bedrooms and Bathrooms
- 2 Bedrooms
- 1 Full Bathroom
Parking
- 2 Car Parking Spaces
- Driveway
- Paved Parking
- Open Parking
- Off-Street Parking
Outdoor Features
- Deck
- Outdoor Storage
- Porch
Utilities
- Window Unit Cooling System
- 2 Heating Zones
- Heating System Uses Natural Gas
- Baseboard Heating
- Electric Baseboard Heater
Additional Features
- Washer
- Property is near schools
Listing and Financial Details
- Assessor Parcel Number 951619
Community Details
Overview
- No Home Owners Association
Amenities
- Medical Services
- Shops
Map
Home Values in the Area
Average Home Value in this Area
Tax History
| Year | Tax Paid | Tax Assessment Tax Assessment Total Assessment is a certain percentage of the fair market value that is determined by local assessors to be the total taxable value of land and additions on the property. | Land | Improvement |
|---|---|---|---|---|
| 2025 | $3,789 | $312,900 | $143,300 | $169,600 |
| 2024 | $3,719 | $309,400 | $143,300 | $166,100 |
| 2023 | $3,466 | $267,000 | $107,700 | $159,300 |
| 2022 | $3,220 | $230,500 | $97,700 | $132,800 |
| 2021 | $3,209 | $221,300 | $88,300 | $133,000 |
| 2020 | $3,119 | $205,900 | $85,000 | $120,900 |
| 2019 | $3,176 | $204,400 | $77,600 | $126,800 |
| 2018 | $2,725 | $169,700 | $77,600 | $92,100 |
| 2017 | $2,272 | $141,100 | $77,600 | $63,500 |
| 2016 | $2,191 | $126,200 | $74,000 | $52,200 |
| 2015 | $2,049 | $112,900 | $74,000 | $38,900 |
| 2014 | $1,842 | $101,600 | $74,000 | $27,600 |
Property History
| Date | Event | Price | List to Sale | Price per Sq Ft |
|---|---|---|---|---|
| 11/12/2025 11/12/25 | For Sale | $400,000 | -- | $444 / Sq Ft |
Purchase History
| Date | Type | Sale Price | Title Company |
|---|---|---|---|
| Deed | $201,500 | -- | |
| Deed | $130,000 | -- | |
| Deed | $69,000 | -- |
Mortgage History
| Date | Status | Loan Amount | Loan Type |
|---|---|---|---|
| Open | $158,500 | No Value Available | |
| Closed | $41,977 | No Value Available |
Source: MLS Property Information Network (MLS PIN)
MLS Number: 73453993
APN: BROC-000019-000142
Disclaimer: Certain information contained herein is derived from information provided by parties other than Homes.com. All information provided is deemed reliable, but is not guaranteed to be accurate and should be independently verified.
![]() The property listing data and information, or the Images, set forth herein were provided to MLS Property Information Network, Inc. from third party sources, including sellers, lessors and public records, and were compiled by MLS Property Information Network, Inc. The property listing data and information, and the Images, are for the personal, non-commercial use of consumers having a good faith interest in purchasing or leasing listed properties of the type displayed to them and may not be used for any purpose other than to identify prospective properties which such consumers may have a good faith interest in purchasing or leasing. MLS Property Information Network, Inc. and its subscribers disclaim any and all representations and warranties as to the accuracy of the property listing data and information, or as to the accuracy of any of the Images, set forth herein.
The property listing data and information, or the Images, set forth herein were provided to MLS Property Information Network, Inc. from third party sources, including sellers, lessors and public records, and were compiled by MLS Property Information Network, Inc. The property listing data and information, and the Images, are for the personal, non-commercial use of consumers having a good faith interest in purchasing or leasing listed properties of the type displayed to them and may not be used for any purpose other than to identify prospective properties which such consumers may have a good faith interest in purchasing or leasing. MLS Property Information Network, Inc. and its subscribers disclaim any and all representations and warranties as to the accuracy of the property listing data and information, or as to the accuracy of any of the Images, set forth herein.
- 847 Pearl St Unit 2
- 215 Belmont Ave Unit 1
- 18 Minot Ave Unit 1
- 58 Brett St Unit 1
- 26 Madrid Square Unit 12
- 244 Washington St Unit 2-303
- 92 Packard Way
- 244 Washington St
- 65 Arlington St Unit 8
- 65 Arlington St
- 98 Union St
- 692 Warren Ave Unit 1
- 436 Warren Ave Unit 1F
- 176 Green St Unit 2
- 70 Weston St Unit 2
- 140 Spring St Unit 1
- 41 Carleton Ave Unit 1
- 41 Carleton Ave Unit 2
- 9 Denton St Unit 3
- 47 W Elm St
