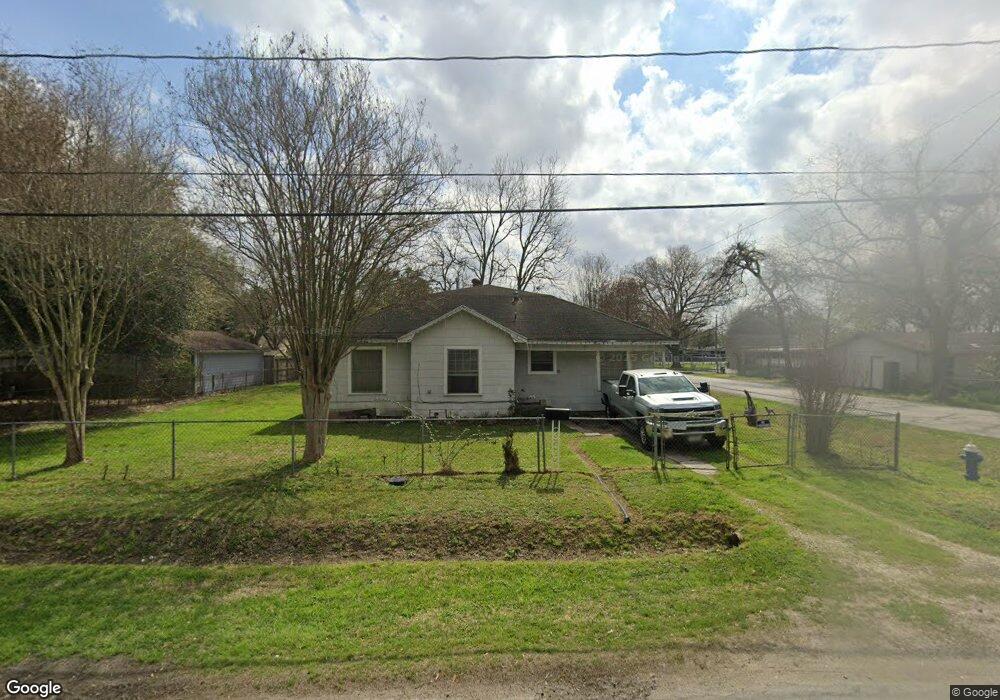
44 De Boll St Houston, TX 77022
Northside-Northline NeighborhoodEstimated Value: $229,679 - $304,000
2
Beds
1
Bath
1,716
Sq Ft
$154/Sq Ft
Est. Value
About This Home
This home is located at 44 De Boll St, Houston, TX 77022 and is currently estimated at $263,670, approximately $153 per square foot. 44 De Boll St is a home located in Harris County with nearby schools including Burbank Elementary School, Burbank Middle School, and Sam Houston Math, Science & Technology Center.
Ownership History
Date
Name
Owned For
Owner Type
Purchase Details
Closed on
Oct 5, 2012
Sold by
Gunderson Doris E and Gunderson Doris Evelyn
Bought by
Lovett Bryan M and Lovett Bryan Merrill
Current Estimated Value
Home Financials for this Owner
Home Financials are based on the most recent Mortgage that was taken out on this home.
Original Mortgage
$50,000
Interest Rate
3.7%
Mortgage Type
Purchase Money Mortgage
Create a Home Valuation Report for This Property
The Home Valuation Report is an in-depth analysis detailing your home's value as well as a comparison with similar homes in the area
Home Values in the Area
Average Home Value in this Area
Purchase History
| Date | Buyer | Sale Price | Title Company |
|---|---|---|---|
| Lovett Bryan M | -- | None Available |
Source: Public Records
Mortgage History
| Date | Status | Borrower | Loan Amount |
|---|---|---|---|
| Closed | Lovett Bryan M | $50,000 |
Source: Public Records
Tax History Compared to Growth
Tax History
| Year | Tax Paid | Tax Assessment Tax Assessment Total Assessment is a certain percentage of the fair market value that is determined by local assessors to be the total taxable value of land and additions on the property. | Land | Improvement |
|---|---|---|---|---|
| 2025 | $4,521 | $216,057 | $75,784 | $140,273 |
| 2024 | $4,521 | $216,057 | $75,784 | $140,273 |
| 2023 | $4,521 | $194,045 | $75,784 | $118,261 |
| 2022 | $3,427 | $155,649 | $57,740 | $97,909 |
| 2021 | $3,231 | $138,619 | $57,740 | $80,879 |
| 2020 | $2,874 | $118,667 | $57,740 | $60,927 |
| 2019 | $2,501 | $98,819 | $37,892 | $60,927 |
| 2018 | $2,085 | $82,389 | $37,892 | $44,497 |
| 2017 | $2,083 | $82,389 | $37,892 | $44,497 |
| 2016 | $1,391 | $80,426 | $37,892 | $42,534 |
| 2015 | $854 | $50,000 | $37,892 | $12,108 |
| 2014 | $854 | $50,000 | $37,892 | $12,108 |
Source: Public Records
Map
Nearby Homes
- 44 Farrell St
- 70 Burress St
- 45 Wellford St
- 61 Trenwood Ln
- Cypress Plan at Wellford Village
- Willow Plan at Wellford Village
- 90 Burress St Unit B
- 90 Burress St Unit A
- 56 Wellford St
- 108 Fichter St
- 9625 Fulton St
- 0 Burbank St Unit 9886770
- 91 Burbank St
- 132 Grothe Ln
- 104 Luetta St
- 106 Luetta St
- 108 Luetta St
- 110 Luetta St
- 216 Burress St
- 40 Dipping Ln