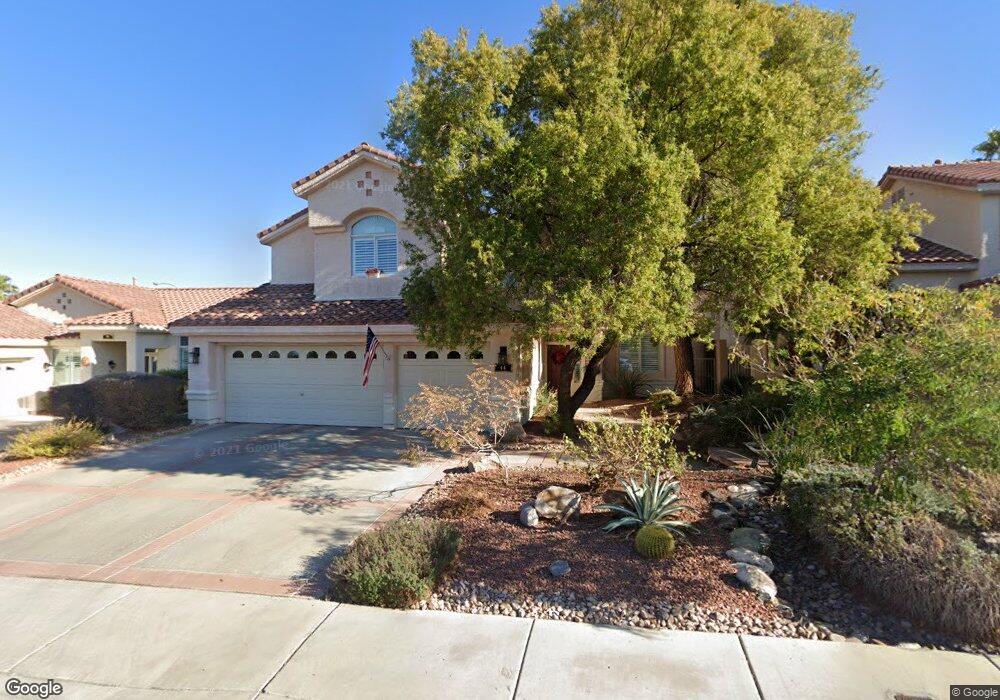
44 Desert Dawn Ln Henderson, NV 89074
Green Valley South NeighborhoodEstimated Value: $433,000 - $501,000
3
Beds
3
Baths
1,954
Sq Ft
$246/Sq Ft
Est. Value
About This Home
This home is located at 44 Desert Dawn Ln, Henderson, NV 89074 and is currently estimated at $481,625, approximately $246 per square foot. 44 Desert Dawn Ln is a home located in Clark County with nearby schools including Selma F Bartlett Elementary School, Barbara and Hank Greenspun Junior High School, and Coronado High School.
Ownership History
Date
Name
Owned For
Owner Type
Purchase Details
Closed on
Mar 20, 2003
Sold by
Tomlin Deborah K
Bought by
Fowler Stephen and Fowler Carole
Current Estimated Value
Home Financials for this Owner
Home Financials are based on the most recent Mortgage that was taken out on this home.
Original Mortgage
$145,500
Outstanding Balance
$62,276
Interest Rate
5.82%
Estimated Equity
$419,349
Purchase Details
Closed on
Oct 13, 1997
Sold by
Carter William W
Bought by
Tomlin Deborah K
Purchase Details
Closed on
Dec 20, 1996
Sold by
Tomlin Deborah K
Bought by
Carter William W and Tomlin Deborah K
Purchase Details
Closed on
Apr 22, 1994
Sold by
Beazer Homes Nevada Inc
Bought by
Tomlin Deborah K
Home Financials for this Owner
Home Financials are based on the most recent Mortgage that was taken out on this home.
Original Mortgage
$124,000
Interest Rate
8.5%
Create a Home Valuation Report for This Property
The Home Valuation Report is an in-depth analysis detailing your home's value as well as a comparison with similar homes in the area
Home Values in the Area
Average Home Value in this Area
Purchase History
| Date | Buyer | Sale Price | Title Company |
|---|---|---|---|
| Fowler Stephen | $169,000 | Equity Title Of Nevada | |
| Tomlin Deborah K | -- | Nevada Title Company | |
| Carter William W | $195,000 | United Title | |
| Tomlin Deborah K | $155,000 | Nevada Title Company |
Source: Public Records
Mortgage History
| Date | Status | Borrower | Loan Amount |
|---|---|---|---|
| Open | Fowler Stephen | $145,500 | |
| Previous Owner | Tomlin Deborah K | $124,000 |
Source: Public Records
Tax History Compared to Growth
Tax History
| Year | Tax Paid | Tax Assessment Tax Assessment Total Assessment is a certain percentage of the fair market value that is determined by local assessors to be the total taxable value of land and additions on the property. | Land | Improvement |
|---|---|---|---|---|
| 2025 | $2,101 | $103,162 | $42,700 | $60,462 |
| 2024 | $2,041 | $103,162 | $42,700 | $60,462 |
| 2023 | $2,041 | $101,769 | $43,925 | $57,844 |
| 2022 | $1,981 | $91,691 | $38,640 | $53,051 |
| 2021 | $1,924 | $79,456 | $28,700 | $50,756 |
| 2020 | $1,865 | $78,204 | $27,650 | $50,554 |
| 2019 | $1,811 | $73,991 | $24,150 | $49,841 |
| 2018 | $1,758 | $72,134 | $24,150 | $47,984 |
| 2017 | $2,084 | $71,908 | $23,100 | $48,808 |
| 2016 | $1,665 | $67,433 | $18,200 | $49,233 |
| 2015 | $1,661 | $56,581 | $14,700 | $41,881 |
| 2014 | $1,613 | $54,015 | $12,950 | $41,065 |
Source: Public Records
Map
Nearby Homes
- 36 Palazzo Terrace
- 59 Desert Dawn Ln
- 1679 Long Horizon Ln
- 1525 Spiced Wine Ave Unit 14101
- 1525 Spiced Wine Ave Unit 24104
- 1525 Spiced Wine Ave Unit 12103
- 1525 Spiced Wine Ave Unit 19103
- 1525 Spiced Wine Ave Unit 27104
- 1553 Sea Sunset Ct
- 1557 Blue Sierra Ct Unit 1
- 90 Ancient Hills Ln
- 54 Ancient Hills Ln
- 1747 Franklin Chase Terrace
- 50 Aura de Blanco St Unit 13202
- 50 Aura de Blanco St Unit 4204
- 50 Aura de Blanco St Unit 19203
- 50 Aura de Blanco St Unit 10203
- 1713 Chris Ave
- 69 Graythorn Mountain Ct
- 75 Graythorn Mountain Ct
- 42 Desert Dawn Ln
- 46 Desert Dawn Ln
- 29 Charmartin St
- 40 Desert Dawn Ln
- 27 Charmartin St
- 31 Charmartin St
- 25 Charmartin St
- 38 Desert Dawn Ln
- 34 Palazzo Terrace
- 36 Birkdale Dr
- 32 Palazzo Terrace
- 23 Charmartin St
- 23 Palazzo Terrace
- 26 Charmartin St
- 30 Palazzo Terrace
- 30 Palazzo Te Terrace
- 34 Birkdale Dr
- 39 Desert Dawn Ln
- 28 Palazzo Terrace
- 28 Palazzo Terrace