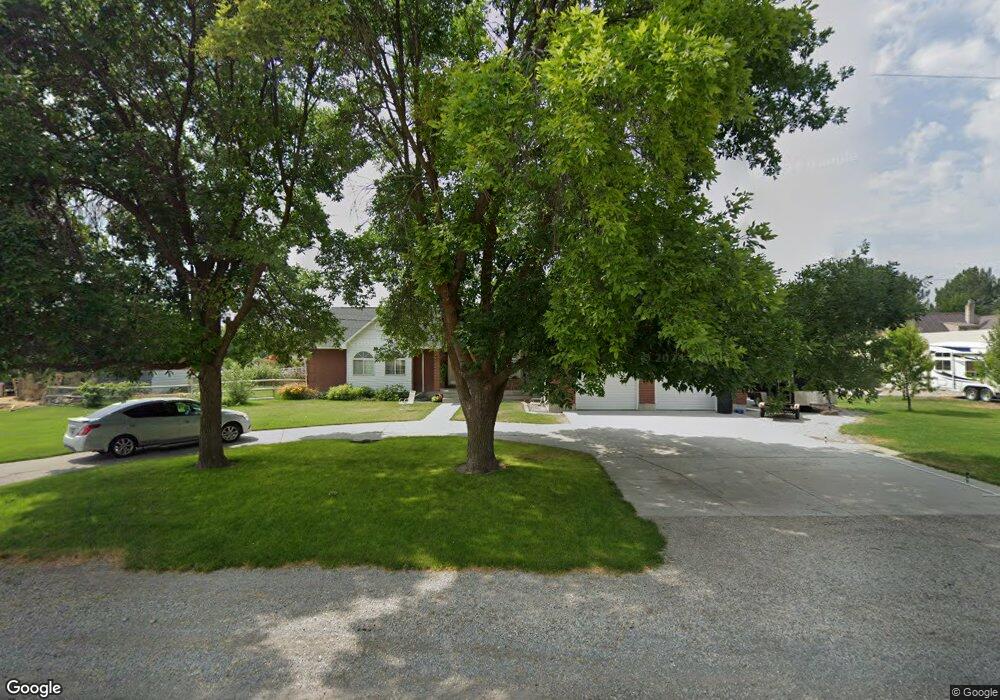
44 E 100 N Newton, UT 84327
Estimated Value: $577,000 - $632,000
5
Beds
4
Baths
3,607
Sq Ft
$167/Sq Ft
Est. Value
About This Home
This home is located at 44 E 100 N, Newton, UT 84327 and is currently estimated at $600,620, approximately $166 per square foot. 44 E 100 N is a home located in Cache County with nearby schools including Lewiston School, White Pine Middle School, and North Cache Middle School.
Ownership History
Date
Name
Owned For
Owner Type
Purchase Details
Closed on
Feb 28, 2018
Sold by
Newmyer Michael and Newmyer Tiffany
Bought by
Call Michael Brock and Call Kate N
Current Estimated Value
Home Financials for this Owner
Home Financials are based on the most recent Mortgage that was taken out on this home.
Original Mortgage
$287,910
Outstanding Balance
$243,580
Interest Rate
4.04%
Mortgage Type
New Conventional
Estimated Equity
$357,040
Purchase Details
Closed on
Jun 16, 2015
Sold by
Griffin David Lee and Griffin Nancy
Bought by
Newmyer Michael and Newmyer Tiffany
Home Financials for this Owner
Home Financials are based on the most recent Mortgage that was taken out on this home.
Original Mortgage
$245,000
Interest Rate
3.77%
Mortgage Type
VA
Purchase Details
Closed on
Jan 2, 2015
Sold by
Griffin David Lee and Griffin Nancy
Bought by
Anderson Gordon A and Anderson Paula M
Purchase Details
Closed on
Dec 30, 2014
Sold by
Griffin Douglas A and Griffin Margaret R
Bought by
Griffin David Lee and Griffin Nancy
Create a Home Valuation Report for This Property
The Home Valuation Report is an in-depth analysis detailing your home's value as well as a comparison with similar homes in the area
Purchase History
| Date | Buyer | Sale Price | Title Company |
|---|---|---|---|
| Call Michael Brock | -- | Advanced Title | |
| Newmyer Michael | -- | American Secure Title Logan | |
| Anderson Gordon A | -- | American Secure Title | |
| Griffin David Lee | -- | American Secure Title |
Source: Public Records
Mortgage History
| Date | Status | Borrower | Loan Amount |
|---|---|---|---|
| Open | Call Michael Brock | $287,910 | |
| Previous Owner | Newmyer Michael | $245,000 |
Source: Public Records
Tax History
| Year | Tax Paid | Tax Assessment Tax Assessment Total Assessment is a certain percentage of the fair market value that is determined by local assessors to be the total taxable value of land and additions on the property. | Land | Improvement |
|---|---|---|---|---|
| 2025 | $2,164 | $315,685 | $0 | $0 |
| 2024 | $2,180 | $291,200 | $0 | $0 |
| 2023 | $2,302 | $290,390 | $0 | $0 |
| 2022 | $2,410 | $290,385 | $0 | $0 |
| 2021 | $2,368 | $436,900 | $73,180 | $363,720 |
| 2020 | $2,212 | $381,380 | $73,180 | $308,200 |
| 2019 | $2,214 | $358,335 | $50,135 | $308,200 |
| 2018 | $1,983 | $318,135 | $50,135 | $268,000 |
| 2017 | $1,656 | $139,560 | $0 | $0 |
| 2016 | $1,679 | $139,560 | $0 | $0 |
| 2015 | $1,473 | $122,295 | $0 | $0 |
| 2014 | $1,359 | $115,500 | $0 | $0 |
| 2013 | -- | $115,500 | $0 | $0 |
Source: Public Records
Map
Nearby Homes
- 312 W 200 N Unit 10
- 222 W 200 N Unit 18
- 165 W 200 N
- 136 W 200 N Unit 21
- 244 W 200 N Unit 17
- 260 W 200 N Unit 16
- 158 W 200 N Unit 20
- 116 W 200 N Unit 22
- 362 W 200 N Unit 8
- 340 W 200 N Unit 9
- 115 N 100 W Unit 23
- 180 N 300 W
- 144 N 300 W Unit 13
- 141 N 300 W Unit 12
- 165 N 300 W Unit 11
- 172 N 300 W Unit 14
- 15 S 400 W
- 7900 N 5600 W
- 9000 N 6400 W
- 6953 W 6600 N Unit 3
Your Personal Tour Guide
Ask me questions while you tour the home.