Estimated Value: $244,085 - $302,000
2
Beds
1
Bath
839
Sq Ft
$322/Sq Ft
Est. Value
About This Home
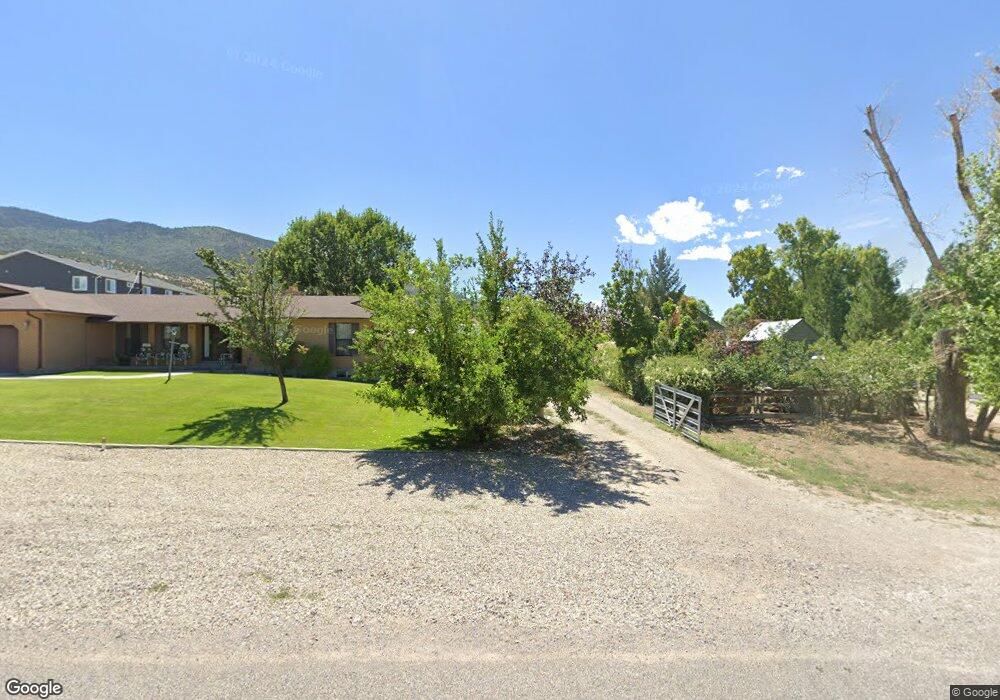
This home is located at 44 E 400 S, Manti, UT 84642 and is currently estimated at $270,021, approximately $321 per square foot. 44 E 400 S is a home located in Sanpete County.
Ownership History
Date
Name
Owned For
Owner Type
Purchase Details
Closed on
Jun 27, 2025
Sold by
Warr Monty and Warr Whitney
Bought by
Worwood Riley F
Current Estimated Value
Home Financials for this Owner
Home Financials are based on the most recent Mortgage that was taken out on this home.
Original Mortgage
$217,500
Outstanding Balance
$216,195
Interest Rate
6.86%
Mortgage Type
New Conventional
Estimated Equity
$53,826
Purchase Details
Closed on
Sep 18, 2024
Sold by
Strunk Glenn W and Strunk Teresa M
Bought by
Warr Monty
Purchase Details
Closed on
Jun 29, 2020
Sold by
Thurston Dane L & Bethany J
Bought by
Strunk Glenn W
Home Financials for this Owner
Home Financials are based on the most recent Mortgage that was taken out on this home.
Original Mortgage
$147,250
Interest Rate
3.2%
Mortgage Type
Construction
Purchase Details
Closed on
Jul 21, 2008
Sold by
Neeley Douglas L and Neeley Cherie W
Bought by
Thurston Dane Lindsay and Thurston Bethany Jane
Create a Home Valuation Report for This Property
The Home Valuation Report is an in-depth analysis detailing your home's value as well as a comparison with similar homes in the area
Home Values in the Area
Average Home Value in this Area
Purchase History
| Date | Buyer | Sale Price | Title Company |
|---|---|---|---|
| Worwood Riley F | $271,875 | Rudd & Hawkes Title Ins Agcy L | |
| Warr Monty | -- | First American Title Ins Co | |
| Strunk Glenn W | $184,062 | First American-Ephraim | |
| Thurston Dane Lindsay | -- | -- |
Source: Public Records
Mortgage History
| Date | Status | Borrower | Loan Amount |
|---|---|---|---|
| Open | Worwood Riley F | $217,500 | |
| Previous Owner | Strunk Glenn W | $147,250 |
Source: Public Records
Tax History
| Year | Tax Paid | Tax Assessment Tax Assessment Total Assessment is a certain percentage of the fair market value that is determined by local assessors to be the total taxable value of land and additions on the property. | Land | Improvement |
|---|---|---|---|---|
| 2025 | $1,877 | $189,399 | $0 | $0 |
| 2024 | $1,507 | $144,839 | $0 | $0 |
| 2023 | $829 | $75,151 | $0 | $0 |
| 2022 | $741 | $61,278 | $0 | $0 |
| 2021 | $714 | $51,099 | $0 | $0 |
| 2020 | $672 | $45,205 | $0 | $0 |
| 2019 | $640 | $42,291 | $0 | $0 |
| 2018 | $627 | $72,882 | $26,730 | $46,152 |
| 2017 | $565 | $37,990 | $0 | $0 |
| 2016 | $528 | $35,544 | $0 | $0 |
| 2015 | $531 | $35,544 | $0 | $0 |
| 2014 | $520 | $35,544 | $0 | $0 |
| 2013 | $511 | $35,164 | $0 | $0 |
Source: Public Records
Map
Nearby Homes
- 106 E 300 S
- 475 S 400 E
- 189 S 300 W
- 375 W 400 S
- 47 N 200 E
- 300 800 S Unit 9
- 245 W 100 N
- 1218 S 500 W Unit 8
- 1255 S 500 W Unit 8
- 1168 S 500 W Unit 1
- 1177 S 500 W Unit 2
- 1205 S 500 W Unit 4
- 1292 S 500 W Unit 11
- 1337 S 500 W Unit 14
- 1322 S 500 W Unit 13
- 1192 S 500 W Unit 3
- 1231 S 500 W Unit 6
- 1268 S 500 W Unit 9
- 678 E Union St
- 50 U S Highway 89
Your Personal Tour Guide
Ask me questions while you tour the home.