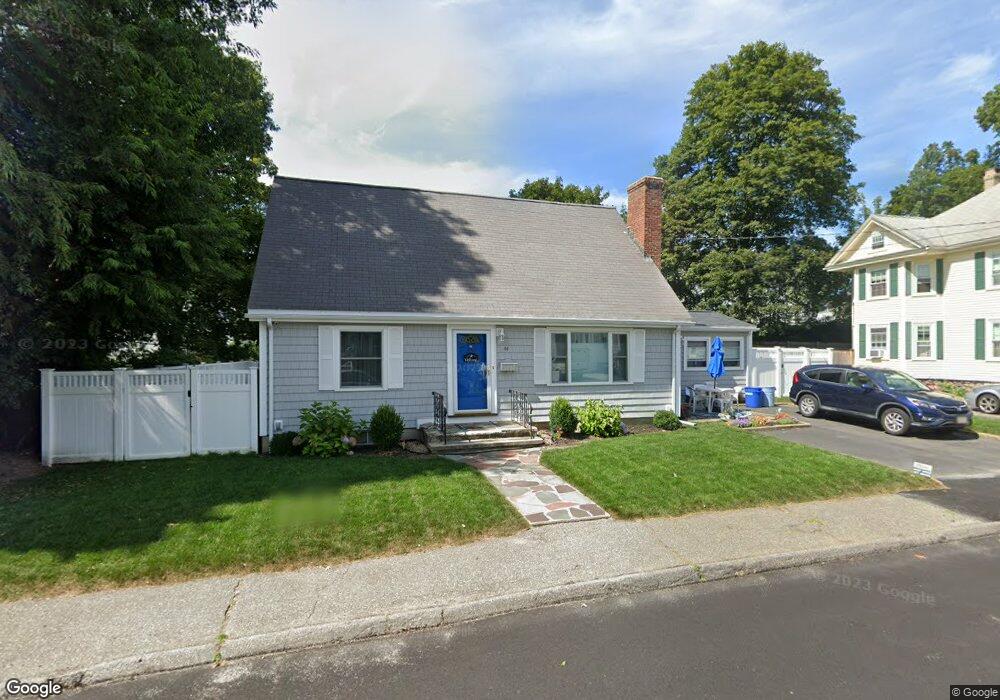
44 Ellis St Woburn, MA 01801
Downtown Woburn NeighborhoodEstimated Value: $536,000 - $760,000
3
Beds
2
Baths
1,685
Sq Ft
$414/Sq Ft
Est. Value
About This Home
This home is located at 44 Ellis St, Woburn, MA 01801 and is currently estimated at $697,972, approximately $414 per square foot. 44 Ellis St is a home located in Middlesex County with nearby schools including Hurld Elementary School, Daniel L. Joyce Middle School, and Woburn High School.
Ownership History
Date
Name
Owned For
Owner Type
Purchase Details
Closed on
Dec 6, 2019
Sold by
Franson Jessie E Est and Tannian
Bought by
Tannian Martin A and Tannian Jennifer E
Current Estimated Value
Purchase Details
Closed on
Aug 15, 2018
Sold by
Jessie E Franson 2010 and Tannian
Bought by
Franson Jessie E
Purchase Details
Closed on
Nov 5, 2010
Sold by
Jessie E Franson T E and Jessie Franson
Bought by
Franson Jessie E
Create a Home Valuation Report for This Property
The Home Valuation Report is an in-depth analysis detailing your home's value as well as a comparison with similar homes in the area
Home Values in the Area
Average Home Value in this Area
Purchase History
| Date | Buyer | Sale Price | Title Company |
|---|---|---|---|
| Tannian Martin A | $363,000 | None Available | |
| Tannian Martin A | $363,000 | None Available | |
| Tannian Martin A | $363,000 | None Available | |
| Tannian Martin A | $363,000 | None Available | |
| Franson Jessie E | -- | -- | |
| Franson Jessie E | -- | -- | |
| Franson Jessie E | -- | -- | |
| Franson Jessie E | -- | -- | |
| Franson Jessie E | -- | -- | |
| Franson Jessie E | -- | -- |
Source: Public Records
Tax History Compared to Growth
Tax History
| Year | Tax Paid | Tax Assessment Tax Assessment Total Assessment is a certain percentage of the fair market value that is determined by local assessors to be the total taxable value of land and additions on the property. | Land | Improvement |
|---|---|---|---|---|
| 2025 | $5,330 | $624,100 | $314,500 | $309,600 |
| 2024 | $4,790 | $594,300 | $299,500 | $294,800 |
| 2023 | $4,701 | $540,400 | $272,300 | $268,100 |
| 2022 | $4,564 | $488,700 | $236,700 | $252,000 |
| 2021 | $4,246 | $455,100 | $225,500 | $229,600 |
| 2020 | $4,166 | $447,000 | $225,500 | $221,500 |
| 2019 | $3,515 | $429,800 | $214,700 | $215,100 |
| 2018 | $3,910 | $395,300 | $197,000 | $198,300 |
| 2017 | $3,658 | $368,000 | $187,600 | $180,400 |
| 2016 | $3,492 | $347,500 | $175,400 | $172,100 |
| 2015 | $3,361 | $330,500 | $163,900 | $166,600 |
| 2014 | $3,148 | $301,500 | $163,900 | $137,600 |
Source: Public Records
Map
Nearby Homes
- 52 Pleasant St
- 18 Beacon St Unit 18
- 26 Flagg St
- 31 Arlington Rd Unit 1-6
- 27 Arlington Rd Unit 1-6
- 29 Arlington Rd Unit 4
- 21 Franklin St
- 11 Hovey St
- 17 Wright St
- 37 1/2 Chestnut St
- 15 Sturgis St
- 477 Main St
- 7 Prospect St
- 34 Union St
- 14 Church Ave
- 14 Church Ave Unit 2
- 7 Locust St
- 35 Prospect St Unit 215
- 35 Prospect St Unit 204
- 18 Church St Unit 2