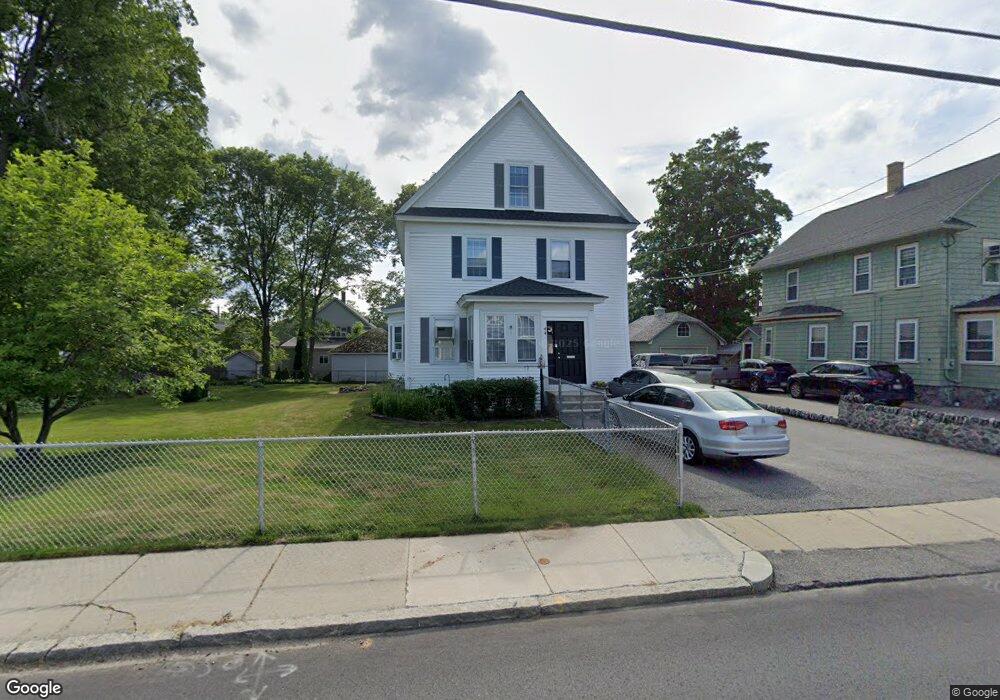
44 Elm St Methuen, MA 01844
Downtown Methuen NeighborhoodEstimated Value: $586,745 - $636,000
4
Beds
2
Baths
1,789
Sq Ft
$338/Sq Ft
Est. Value
About This Home
This home is located at 44 Elm St, Methuen, MA 01844 and is currently estimated at $604,186, approximately $337 per square foot. 44 Elm St is a home located in Essex County with nearby schools including Mendota Elementary School, Tenney Grammar School, and South Point Elementary School.
Ownership History
Date
Name
Owned For
Owner Type
Purchase Details
Closed on
Sep 10, 2021
Sold by
Gillespie Bethany and Gillespie Steven
Bought by
Gillespie Bethany and Gillespie Steven
Current Estimated Value
Home Financials for this Owner
Home Financials are based on the most recent Mortgage that was taken out on this home.
Original Mortgage
$330,000
Outstanding Balance
$298,963
Interest Rate
2.8%
Mortgage Type
New Conventional
Estimated Equity
$305,223
Purchase Details
Closed on
Aug 29, 2013
Sold by
Riopelle Rita A
Bought by
Gillespie Bethany and Gillespie Steven
Home Financials for this Owner
Home Financials are based on the most recent Mortgage that was taken out on this home.
Original Mortgage
$201,286
Interest Rate
4.25%
Mortgage Type
FHA
Create a Home Valuation Report for This Property
The Home Valuation Report is an in-depth analysis detailing your home's value as well as a comparison with similar homes in the area
Home Values in the Area
Average Home Value in this Area
Purchase History
| Date | Buyer | Sale Price | Title Company |
|---|---|---|---|
| Gillespie Bethany | -- | None Available | |
| Gillespie Bethany | -- | None Available | |
| Gillespie Bethany | -- | None Available | |
| Gillespie Bethany | $205,000 | -- |
Source: Public Records
Mortgage History
| Date | Status | Borrower | Loan Amount |
|---|---|---|---|
| Open | Gillespie Bethany | $330,000 | |
| Closed | Gillespie Bethany | $330,000 | |
| Previous Owner | Gillespie Bethany | $201,286 |
Source: Public Records
Tax History Compared to Growth
Tax History
| Year | Tax Paid | Tax Assessment Tax Assessment Total Assessment is a certain percentage of the fair market value that is determined by local assessors to be the total taxable value of land and additions on the property. | Land | Improvement |
|---|---|---|---|---|
| 2025 | $5,444 | $514,600 | $189,900 | $324,700 |
| 2024 | $5,163 | $475,400 | $158,300 | $317,100 |
| 2023 | $5,159 | $440,900 | $158,300 | $282,600 |
| 2022 | $4,887 | $374,500 | $129,500 | $245,000 |
| 2021 | $4,607 | $349,300 | $122,300 | $227,000 |
| 2020 | $4,572 | $340,200 | $122,300 | $217,900 |
| 2019 | $4,386 | $309,100 | $115,100 | $194,000 |
| 2018 | $4,183 | $293,100 | $107,900 | $185,200 |
| 2017 | $4,074 | $278,100 | $107,900 | $170,200 |
| 2016 | $3,861 | $260,700 | $93,500 | $167,200 |
| 2015 | $3,644 | $249,600 | $93,500 | $156,100 |
Source: Public Records
Map
Nearby Homes
- 8 Francella Rd
- 134 Haverhill St
- 2 Glen Forest Ln
- 88-90 Columbus Ave
- 14-16 Cypress Ave
- 47 Hallenan Ave
- 32 Glen Ave
- 2 Maurice Ave
- 68 Middlebury St
- 57 Strathmore Rd
- 945 Riverside Dr Unit 2A
- 35 Memorial Dr
- 362 Lowell St
- 65 Clayton Ave
- 17-19 Maplewood Ave
- 749-751 Riverside Dr
- 11 Vineyard Ln Unit 11
- 37 Maplewood Ave
- 265 Ames St
- 50 Forest St