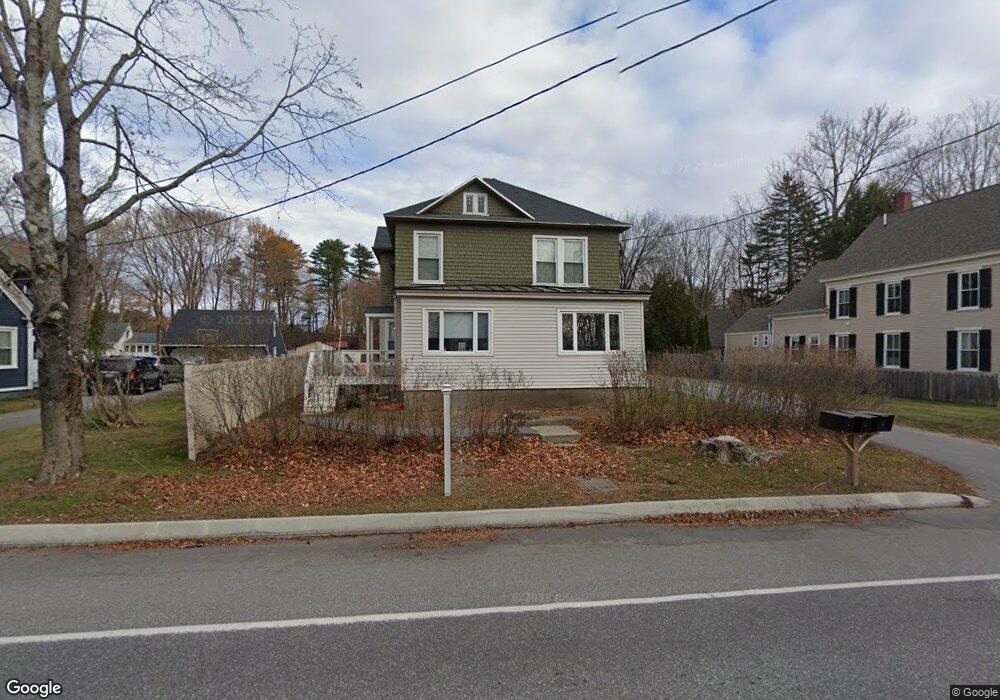
44 Elm St Topsham, ME 04086
Estimated Value: $537,589
1
Bed
1
Bath
6,402
Sq Ft
$84/Sq Ft
Est. Value
About This Home
This home is located at 44 Elm St, Topsham, ME 04086 and is currently estimated at $537,589, approximately $83 per square foot. 44 Elm St is a home located in Sagadahoc County with nearby schools including Mt Ararat High School, Harpswell Coastal Academy Divisions 2 and 3, and St. John's Catholic School.
Ownership History
Date
Name
Owned For
Owner Type
Purchase Details
Closed on
Jun 4, 2021
Sold by
Aj Property Holdings Llc
Bought by
44 Elm Llc
Current Estimated Value
Home Financials for this Owner
Home Financials are based on the most recent Mortgage that was taken out on this home.
Original Mortgage
$300,000
Outstanding Balance
$270,427
Interest Rate
2.9%
Mortgage Type
Purchase Money Mortgage
Estimated Equity
$267,162
Purchase Details
Closed on
Jun 15, 2018
Sold by
Samson Michael J and Samson Rebecca P
Bought by
Aj Property Holdings Llc
Create a Home Valuation Report for This Property
The Home Valuation Report is an in-depth analysis detailing your home's value as well as a comparison with similar homes in the area
Home Values in the Area
Average Home Value in this Area
Purchase History
| Date | Buyer | Sale Price | Title Company |
|---|---|---|---|
| 44 Elm Llc | -- | None Available | |
| Aj Property Holdings Llc | -- | -- |
Source: Public Records
Mortgage History
| Date | Status | Borrower | Loan Amount |
|---|---|---|---|
| Open | 44 Elm Llc | $300,000 |
Source: Public Records
Tax History Compared to Growth
Tax History
| Year | Tax Paid | Tax Assessment Tax Assessment Total Assessment is a certain percentage of the fair market value that is determined by local assessors to be the total taxable value of land and additions on the property. | Land | Improvement |
|---|---|---|---|---|
| 2025 | $3,652 | $285,300 | $81,500 | $203,800 |
| 2024 | $3,495 | $279,600 | $75,800 | $203,800 |
| 2023 | $3,747 | $275,900 | $72,100 | $203,800 |
| 2022 | $3,941 | $273,300 | $69,500 | $203,800 |
| 2021 | $4,247 | $267,600 | $63,800 | $203,800 |
| 2020 | $4,779 | $267,600 | $63,800 | $203,800 |
| 2019 | $5,023 | $262,300 | $58,500 | $203,800 |
| 2018 | $4,795 | $256,000 | $52,200 | $203,800 |
| 2017 | $4,639 | $256,000 | $52,200 | $203,800 |
| 2016 | $4,605 | $256,000 | $52,200 | $203,800 |
| 2015 | $4,513 | $251,300 | $47,500 | $203,800 |
| 2014 | $4,355 | $251,300 | $47,500 | $203,800 |
| 2013 | $4,184 | $251,300 | $47,500 | $203,800 |
Source: Public Records
Map
Nearby Homes
- 4 Wilson St
- 86 Merrymeeting Rd
- 118 Main St
- 15 Minat Ave
- 26 Merrymeeting Rd
- 29 Winter St
- 21 Barrows Dr
- 19 Mason St
- 10 Merrymeeting Dr
- 11 Lincoln St
- 57 Winter St
- 55 Somerset Place
- 44 Forest Glen Ln
- 28 Forest Glen Ln
- 43 Forest Glen Ln
- 19 Forest Glen Ln
- 23 Forest Glen Ln
- 2 Jasper Dr
- 35 Bath Rd
- 35.5 Bath Rd