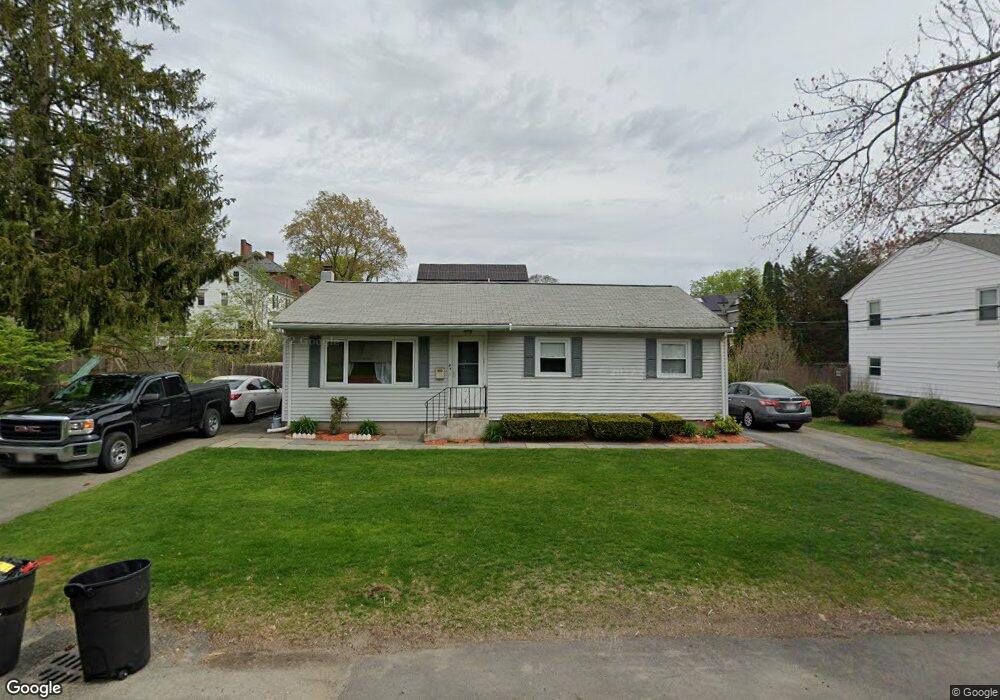
44 Fairfield St Maynard, MA 01754
Estimated Value: $467,042 - $599,000
3
Beds
2
Baths
1,008
Sq Ft
$528/Sq Ft
Est. Value
About This Home
This home is located at 44 Fairfield St, Maynard, MA 01754 and is currently estimated at $532,011, approximately $527 per square foot. 44 Fairfield St is a home located in Middlesex County with nearby schools including Green Meadow School, Fowler School, and Maynard High School.
Ownership History
Date
Name
Owned For
Owner Type
Purchase Details
Closed on
May 7, 1992
Sold by
Greene Jeffrey P and Greene Evelyn V
Bought by
Bordenca Robert J and Bordenca Denise C
Current Estimated Value
Home Financials for this Owner
Home Financials are based on the most recent Mortgage that was taken out on this home.
Original Mortgage
$104,800
Interest Rate
8.91%
Mortgage Type
Purchase Money Mortgage
Create a Home Valuation Report for This Property
The Home Valuation Report is an in-depth analysis detailing your home's value as well as a comparison with similar homes in the area
Home Values in the Area
Average Home Value in this Area
Purchase History
| Date | Buyer | Sale Price | Title Company |
|---|---|---|---|
| Bordenca Robert J | $131,000 | -- |
Source: Public Records
Mortgage History
| Date | Status | Borrower | Loan Amount |
|---|---|---|---|
| Closed | Bordenca Robert J | $105,000 | |
| Closed | Bordenca Robert J | $104,800 |
Source: Public Records
Tax History
| Year | Tax Paid | Tax Assessment Tax Assessment Total Assessment is a certain percentage of the fair market value that is determined by local assessors to be the total taxable value of land and additions on the property. | Land | Improvement |
|---|---|---|---|---|
| 2025 | $7,444 | $417,500 | $270,100 | $147,400 |
| 2024 | $7,027 | $393,000 | $257,300 | $135,700 |
| 2023 | $6,911 | $364,300 | $245,000 | $119,300 |
| 2022 | $6,548 | $319,100 | $205,800 | $113,300 |
| 2021 | $6,428 | $319,000 | $205,800 | $113,200 |
| 2020 | $6,266 | $303,600 | $186,200 | $117,400 |
| 2019 | $7,882 | $288,100 | $177,900 | $110,200 |
| 2018 | $7,314 | $268,100 | $161,700 | $106,400 |
| 2017 | $5,901 | $268,100 | $161,700 | $106,400 |
| 2016 | $5,697 | $268,100 | $161,700 | $106,400 |
| 2015 | $5,571 | $249,700 | $154,400 | $95,300 |
| 2014 | $5,229 | $234,600 | $149,500 | $85,100 |
Source: Public Records
Map
Nearby Homes
- 38 Fairfield St
- 13 Arthur St Unit 15
- 31-33 Roosevelt St
- 5 Hayes St Unit 5
- 22 Douglas Ave Unit 2
- 22 Douglas Ave Unit 1
- 62 Waltham St
- 2 Wall Ct
- 41 Taylor Rd
- 70 Powder Mill Rd
- 12 Brown St
- 23 Deer Path Unit 5
- 36 Brown St
- 6 Nancy Cir
- 153 Summer St
- 8 Snowberry Ln
- 48 Chanticleer Rd
- 1 Carlton Dr
- 68 Longfellow Rd
- 63 Conant St
- 42 Fairfield St
- 46 Fairfield St
- 41 Elmwood St
- 39 Elmwood St
- 47-49 Elmwood St Unit 47
- 47-49 Elmwood St Unit 49
- 47-49 Elmwood St
- 40 Fairfield St
- 47 Elmwood St Unit 49
- 43 Fairfield St
- 39 Fairfield St
- 51 Parker St
- 37 Elmwood St
- 47 Parker St
- 41 Fairfield St
- 35 1/2 Fairfield St
- 33 Elmwood St
- 50 Parker St
- 48 Parker St
- 46 Parker St
Your Personal Tour Guide
Ask me questions while you tour the home.