Estimated Value: $182,000 - $277,000
3
Beds
2
Baths
1,030
Sq Ft
$235/Sq Ft
Est. Value
About This Home
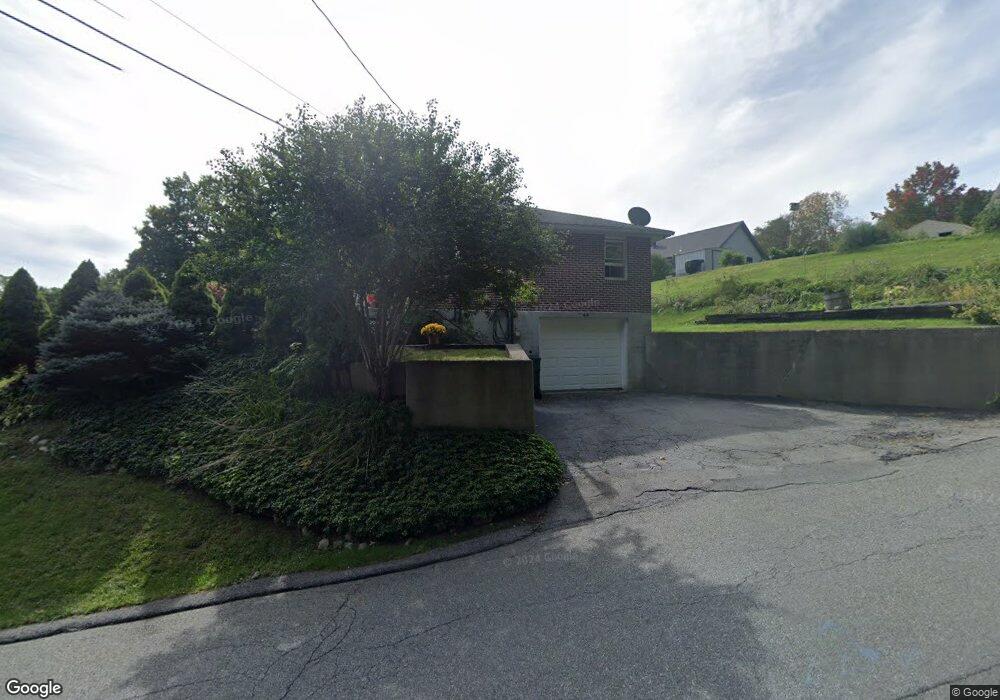
This home is located at 44 Fisk Rd, Adams, MA 01220 and is currently estimated at $241,758, approximately $234 per square foot. 44 Fisk Rd is a home located in Berkshire County with nearby schools including Hoosac Valley Middle & High School, Berkshire Arts & Technology Charter Public School, and St. Stanislaus Kostka School.
Ownership History
Date
Name
Owned For
Owner Type
Purchase Details
Closed on
Jul 31, 2020
Sold by
Hartwig Stephen J and Tenczar Sarah A
Bought by
Oneil-Hopkins Bridget
Current Estimated Value
Home Financials for this Owner
Home Financials are based on the most recent Mortgage that was taken out on this home.
Original Mortgage
$143,560
Outstanding Balance
$127,583
Interest Rate
3.1%
Mortgage Type
New Conventional
Estimated Equity
$114,175
Create a Home Valuation Report for This Property
The Home Valuation Report is an in-depth analysis detailing your home's value as well as a comparison with similar homes in the area
Home Values in the Area
Average Home Value in this Area
Purchase History
| Date | Buyer | Sale Price | Title Company |
|---|---|---|---|
| Oneil-Hopkins Bridget | $148,000 | None Available |
Source: Public Records
Mortgage History
| Date | Status | Borrower | Loan Amount |
|---|---|---|---|
| Open | Oneil-Hopkins Bridget | $143,560 |
Source: Public Records
Tax History Compared to Growth
Tax History
| Year | Tax Paid | Tax Assessment Tax Assessment Total Assessment is a certain percentage of the fair market value that is determined by local assessors to be the total taxable value of land and additions on the property. | Land | Improvement |
|---|---|---|---|---|
| 2025 | $3,511 | $206,400 | $53,300 | $153,100 |
| 2024 | $3,312 | $188,800 | $50,100 | $138,700 |
| 2023 | $3,070 | $165,500 | $45,500 | $120,000 |
| 2022 | $2,989 | $143,100 | $39,600 | $103,500 |
| 2021 | $3,278 | $144,900 | $39,600 | $105,300 |
| 2020 | $3,068 | $140,200 | $39,600 | $100,600 |
| 2019 | $2,999 | $140,200 | $39,600 | $100,600 |
| 2018 | $3,074 | $138,400 | $39,600 | $98,800 |
| 2017 | $2,958 | $138,400 | $39,600 | $98,800 |
| 2016 | $2,761 | $129,100 | $39,600 | $89,500 |
| 2015 | $2,703 | $126,500 | $41,400 | $85,100 |
| 2014 | $2,524 | $126,500 | $41,400 | $85,100 |
Source: Public Records
Map
Nearby Homes
- 10 Enterprise St
- 50 Commercial St
- 219 West Rd
- 4 Edmunds St Unit A101
- 9 Pinnacle Point
- 29 Crandall St
- 34-36 Crandall St
- 6 Crandall St
- 2 Melrose St
- 3 Melrose St
- 71 Park St Unit 75
- 30 Summer St
- 52 Alger St
- 9 Beecher St
- 17 Morningside Ave
- 2 Valley St
- 21 Overlook Terrace
- 5 Richmond St
- 16-18 E Hoosac St
- 27 2nd St