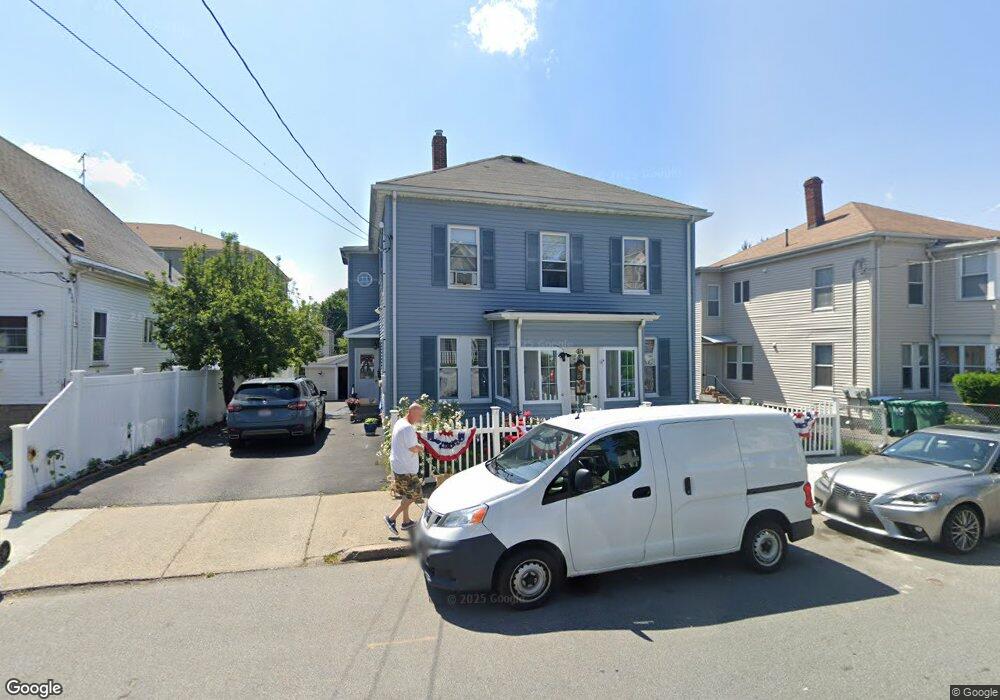
44 Flint St Lynn, MA 01905
Lower Boston Street NeighborhoodEstimated Value: $584,000 - $655,502
12
Beds
3
Baths
4,740
Sq Ft
$129/Sq Ft
Est. Value
About This Home
This home is located at 44 Flint St, Lynn, MA 01905 and is currently estimated at $609,626, approximately $128 per square foot. 44 Flint St is a home located in Essex County with nearby schools including William R. Fallon School, Lincoln-Thomson Elementary School, and Breed Middle School.
Ownership History
Date
Name
Owned For
Owner Type
Purchase Details
Closed on
Mar 14, 2025
Sold by
Psallidas Ilias and Psallidas Stavroula
Bought by
Voulas Ft and Psallidas
Current Estimated Value
Home Financials for this Owner
Home Financials are based on the most recent Mortgage that was taken out on this home.
Original Mortgage
$210,000
Outstanding Balance
$208,581
Interest Rate
6.95%
Mortgage Type
Second Mortgage Made To Cover Down Payment
Estimated Equity
$401,045
Purchase Details
Closed on
Aug 13, 2004
Sold by
Ennis Roger E
Bought by
Psallidas Illias
Purchase Details
Closed on
May 31, 1994
Sold by
George Harry and George Charles
Bought by
Ennis Roger E
Create a Home Valuation Report for This Property
The Home Valuation Report is an in-depth analysis detailing your home's value as well as a comparison with similar homes in the area
Home Values in the Area
Average Home Value in this Area
Purchase History
| Date | Buyer | Sale Price | Title Company |
|---|---|---|---|
| Voulas Ft | $172,500 | None Available | |
| Voulas Ft | $172,500 | None Available | |
| Voulas Ft | $172,500 | None Available | |
| Psallidas Illias | $300,000 | -- | |
| Psallidas Illias | $300,000 | -- | |
| Ennis Roger E | $74,000 | -- | |
| Ennis Roger E | $74,000 | -- |
Source: Public Records
Mortgage History
| Date | Status | Borrower | Loan Amount |
|---|---|---|---|
| Open | Voulas Ft | $210,000 | |
| Closed | Voulas Ft | $210,000 | |
| Previous Owner | Ennis Roger E | $272,000 | |
| Previous Owner | Ennis Roger E | $299,300 |
Source: Public Records
Tax History
| Year | Tax Paid | Tax Assessment Tax Assessment Total Assessment is a certain percentage of the fair market value that is determined by local assessors to be the total taxable value of land and additions on the property. | Land | Improvement |
|---|---|---|---|---|
| 2025 | $6,024 | $581,500 | $226,600 | $354,900 |
| 2024 | $5,529 | $525,100 | $199,100 | $326,000 |
| 2023 | $5,285 | $474,000 | $205,600 | $268,400 |
| 2022 | $5,049 | $406,200 | $152,300 | $253,900 |
| 2021 | $4,821 | $370,000 | $140,000 | $230,000 |
| 2020 | $4,778 | $356,600 | $134,800 | $221,800 |
| 2019 | $4,590 | $321,000 | $126,900 | $194,100 |
| 2018 | $4,756 | $313,900 | $140,000 | $173,900 |
| 2017 | $4,348 | $278,700 | $116,400 | $162,300 |
| 2016 | $4,187 | $258,800 | $108,900 | $149,900 |
| 2015 | $4,038 | $241,100 | $108,100 | $133,000 |
Source: Public Records
Map
Nearby Homes
- 46 Wilfred St
- 70 Wyman St
- 73 Waterhill St
- 590 Boston St Unit 303
- 50-50A Kirtland St
- 78-80 Spencer St
- 20 Murray St
- 268 Walnut St
- 79 Laurel St
- 45 Cottage St Unit 3
- 34 Grove St
- 16 Salem St
- 6 Morris St
- 76-78 Linden St
- 32 Birch Brook Landing Unit 23
- 32 Birch Brook Landing Unit 25
- 32 Birch Brook Landing Unit 22
- 11 Margin St Unit 7
- 32 Birch Brook Rd Unit 13
- 32 Birch Brook Rd Unit 27
- 48 Flint St
- 40 Flint St
- 36 Flint St
- 38 Flint St
- 45 Wyman St
- 52 Flint St
- 49 Wyman St
- 53 Wyman St
- 35 Wyman St Unit 306
- 35 Wyman St Unit 305
- 35 Wyman St Unit 304
- 35 Wyman St Unit 303
- 35 Wyman St Unit 302
- 35 Wyman St Unit 301
- 35 Wyman St Unit 206
- 35 Wyman St Unit 205
- 35 Wyman St Unit 204
- 35 Wyman St Unit 203
- 35 Wyman St Unit 202
- 35 Wyman St Unit 201
Your Personal Tour Guide
Ask me questions while you tour the home.